loopview
Graphically analyze results of control system tuning using slTuner interface
Description
loopview( plots
characteristics of the control system described by the st,controls,measurements)slTuner interface st.
Use loopview to analyze the performance of a
tuned control system you obtain using looptune.
loopview plots:
The gains of the open-loop frequency response measured at the plant inputs (
controlsanalysis points) and at plant outputs (measurementsanalysis points)The (largest) gain of the sensitivity and complementary sensitivity functions at the plant inputs or outputs
loopview( uses
the st,info)info structure returned by looptune and
also plots the target and tuned values of tuning constraints imposed
on the system. Use this syntax to assist in troubleshooting when tuning
fails to meet all requirements.
Additional plots with this syntax include:
Normalized multi-loop disk margins at the plant inputs and outputs. For more information about disk margins, see Stability Analysis Using Disk Margins (Robust Control Toolbox).
Target vs. achieved response for any additional tuning goal you used with
looptune.
Examples
Tune the Simulink® model, rct_engine_speed, to achieve a specified settling time. Use loopview to graphically analyze the tuning results.
Open the model.
mdl = 'rct_engine_speed';
open_system(mdl);
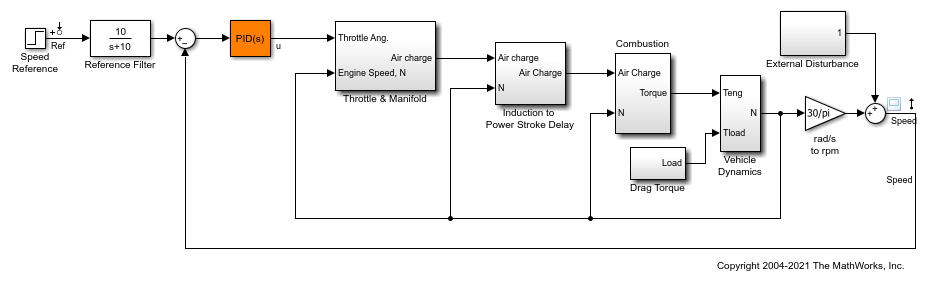
Create an slTuner interface for the model and specify the PID Controller block to be tuned.
st0 = slTuner(mdl,'PID Controller');
Specify a requirement to achieve a 2 second settling time for the Speed signal when tracking the reference signal.
req = TuningGoal.Tracking('Ref','Speed',2);
Tune the PID Controller block.
addPoint(st0,'u')

control = 'u';
measurement = 'Speed';

wc = 1;

[st1,gam,info] = looptune(st0,control,measurement,wc);
Final: Peak gain = 0.93, Iterations = 5
Achieved target gain value TargetGain=1.
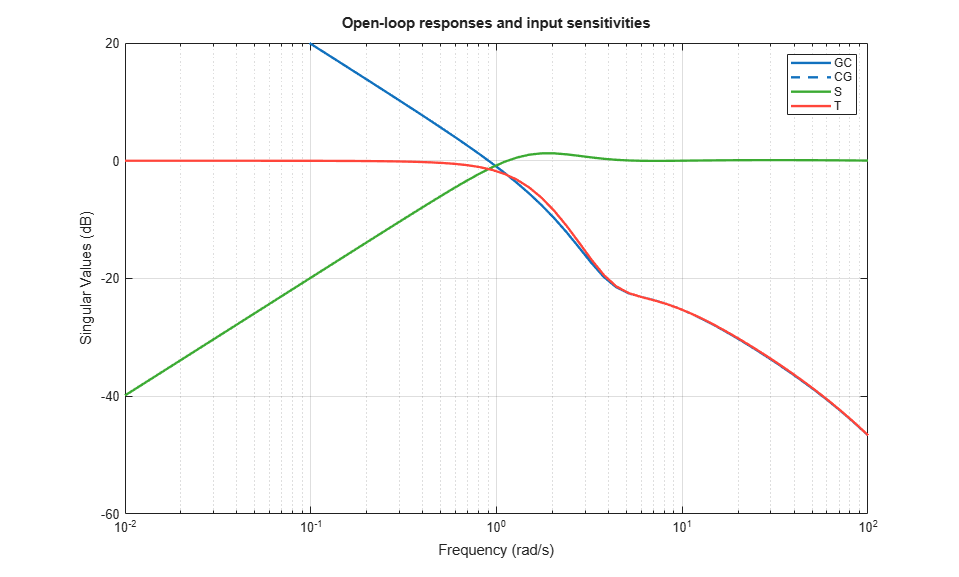
View the response of the model for the tuned block values.
loopview(st1,control,measurement);
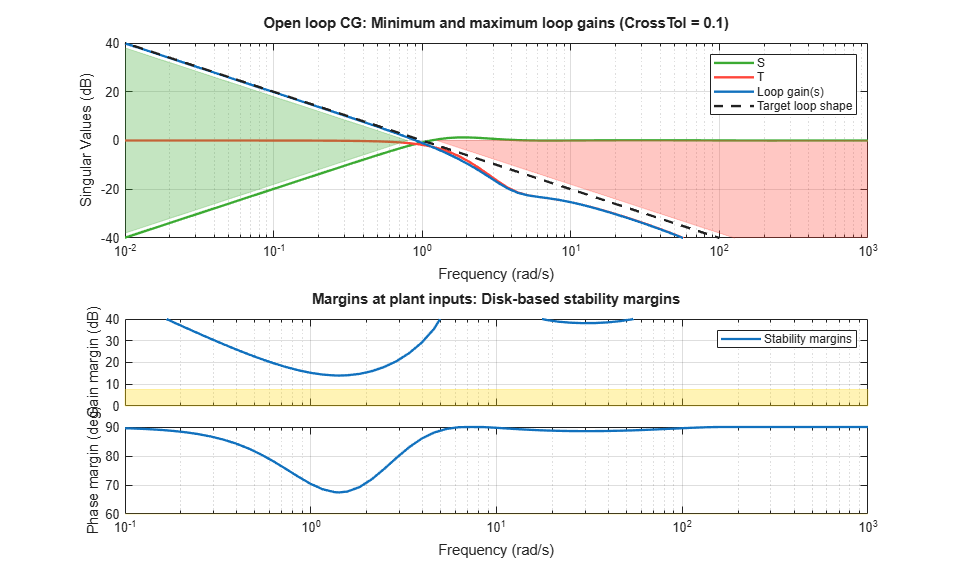
Compare the performance of the tuned block against the tuning goals.
figure
loopview(st1,info);
Input Arguments
Alternative Functionality
For analyzing Control System Toolbox™ models tuned with looptune, use loopview.
Version History
Introduced in R2014a