Multiobjective Tradeoff Analysis
This topic shows how you can visualize and analyze the tradeoffs among multiple design outcomes in a multiobjective optimization problem using Simulink® Design Optimization™ software.
A single objective with several constraints might not adequately represent some optimization problems. Examples of optimization problems include analyzing design tradeoffs, selecting optimal product or process designs, or solving any other problem where you need an optimal solution with tradeoffs between two or more conflicting objectives. For all of these problems, there is a vector of objectives that you must trade off. The relative importance of these objectives is not generally known until you determine the system's best capabilities and understand the tradeoffs between the objectives. As the number of objectives increases, tradeoffs are likely to become more complex and less easily quantified. You must then rely on your intuition and ability to express preferences throughout the optimization cycle.
Multiobjective Optimization
Multiobjective optimization concerns the minimization of a vector of objectives F(x) that can be the subject of a number of constraints or bounds. Because F(x) is a vector, if any of the components of F(x) are competing, there is no unique solution to this problem. Instead, the concept of noninferiority must be used to characterize the objectives.
A nondominated solution, also called a noninferior solution, is one in which an improvement in one objective requires a degradation in another. A Pareto front, also called a Pareto optima, finds nondominated solutions. Constructing the Pareto optima is a general goal in multiobjective optimization. You can find solutions using either a direct (pattern) search solver or a genetic algorithm. You can apply both methods to smooth or nonsmooth problems with linear and nonlinear constraints.
For more information on multiobjective optimization, see What Is Multiobjective Optimization? (Global Optimization Toolbox).
Multiobjective Tradeoff Analysis in Response Optimizer
In the Response Optimizer app, you can visualize the tradeoffs among multiple objectives for Pareto-optimal design variables using a multiobjective scatter plot.
The multiobjective scatter plot shows the objective values for all Pareto-optimal outcomes. If there are more than two objectives, the multiobjective scatter plot consists of pairwise scatter plots. Each point in the plot is a design outcome that corresponds to a row in the tradeoff result table. The plot helps you select the design outcome that best solves the tradeoff among the objectives. The multiobjective scatter plot is only available when there are two or more objectives.

You can also create a parallel coordinates plot from the tradeoff result table.
Each line in the parallel plot represents a row in the tradeoff result table. Each coordinate variable in the plot corresponds to a column in the table.

For information on the multiobjective scatter plot and the parallel plot, see Interact with Plots.
Multiobjective Tradeoff Analysis in Sensitivity Analyzer
In the Sensitivity Analyzer app, you can visualize the objective (requirement) space by making a multiobjective scatter plot of the evaluated results. The multiobjective scatter plot option is only available when there are two or more requirements that either minimize or maximize the cost.
The multiobjective scatter plot shows the objective values for all possible combinations of the parameters. If there are more than two objectives, the multiobjective scatter plot consists of pairwise scatter plots. Each point in the plot is a design outcome that corresponds to a row in the evaluation result table. The plot determines the optimal, feasible, and infeasible designs, and helps you select the design outcome that best solves the tradeoff between the objectives. By default, the plot displays:
Pareto-optimal outcomes
Feasible non-optimal outcomes
Infeasible outcomes

You can also create a parallel coordinates plot from the evaluation results table. The parallel plot option is only available when there are two or more requirements that either minimize or maximize the cost.
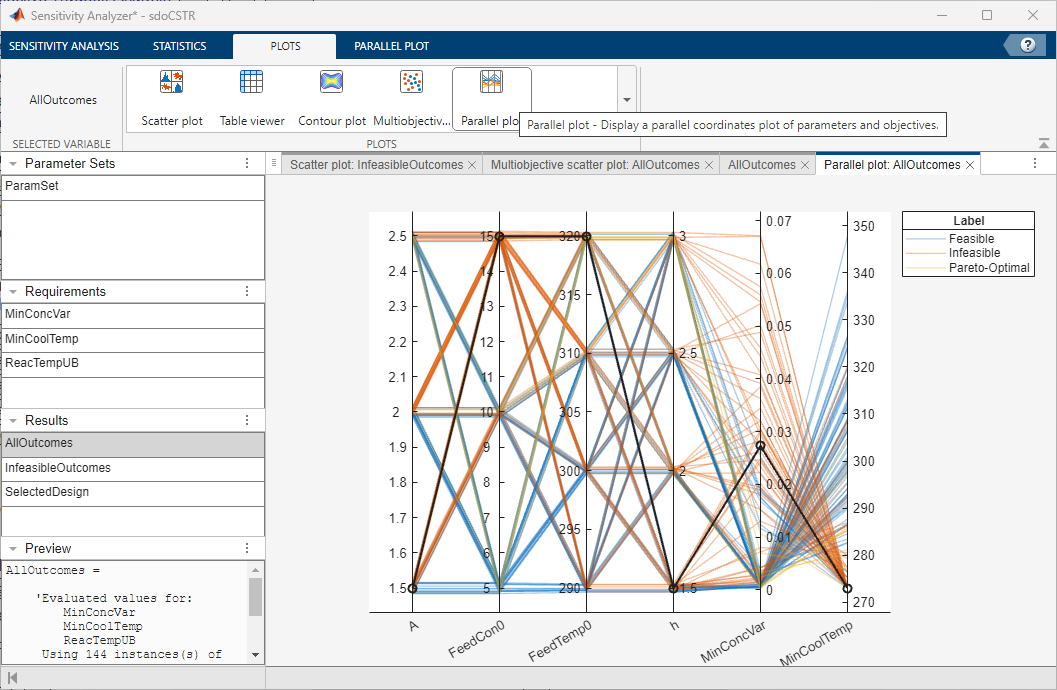
For more information on the multiobjective scatter plot and the parallel plot, see Interact with Plots in Sensitivity Analyzer.
Multiobjective Tradeoff Analysis in Command Line
To obtain the Pareto-optimal designs programmatically, you can specify the
Method property of sdo.OptimizeOptions
as 'paretosearch'. For more information, see sdo.OptimizeOptions.
See Also
paretosearch (Global Optimization Toolbox) | parallelplot
Topics
- Design Selection Using Multiobjective Tradeoff Analysis
- Multiobjective Tradeoff Analysis of Power Grid Model
- What Is Multiobjective Optimization? (Global Optimization Toolbox)
- Interact with Plots
- Interact with Plots in Sensitivity Analyzer
- paretosearch Algorithm (Global Optimization Toolbox)