Clutch Friction Coefficient Estimation
This example shows how to use Simulink® Design Optimization™ to estimate parameters of a clutch model created using Simscape™ Driveline™ library blocks.
Requires Simscape Driveline.
Description of Clutch Model
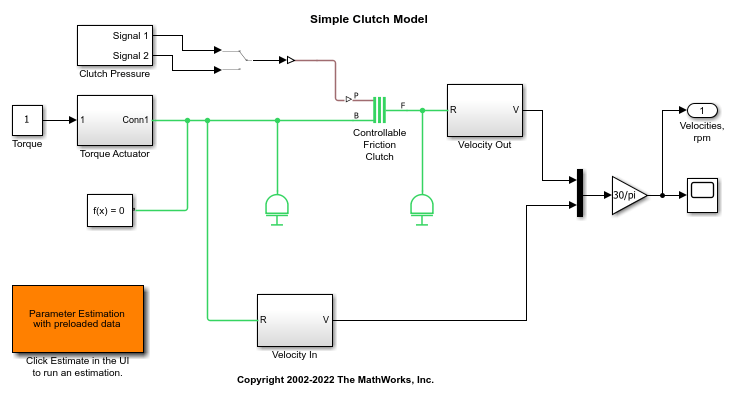
The Simulink® model of the clutch system, simple_clutch, is shown below.
This model consists of two inertias coupled by a clutch. Initially, the pressure applied to the clutch plates is zero and Inertia 2 has zero velocity. A constant torque is also applied to Inertia 1. Once the clutch pressure starts increasing, Inertia 2 starts rotating. However, the friction between the clutch plates causes slippage so that the two inertias accelerate at different rates and have different velocities.
The clutch system consists of two rotational inertias and a clutch. Pressure is applied to the clutch plates, which then couples the two inertias. A Simscape Driveline block is used to model the clutch, which has a speed-dependent friction coefficient linearly varying from C1 at 0 rad/s to C2 at 10 rad/s.
The coefficients of friction (C1, C2) in the Controllable Friction Clutch block are unknown and are estimated using experimental data for the output velocities of Inertia 1 and Inertia 2.
open_system('simple_clutch')
Using Simulink Design Optimization
In the Apps tab, click Parameter Estimator under Control Systems to launch the Parameter Estimator app.
The launched Parameter Estimation UI consists of projects where we store our experimental data sets and estimation results. These projects can be saved and reused later.
Alternatively, you can double-click the orange colored block at the lower left corner of the Simulink diagram. This will reload a project that has already been saved.
In general, estimating model parameters consists of three main steps: importing experimental data sets into the project, selecting the model parameters for estimation, and running an estimation and analyzing the results.
Experimental Data for Estimation
We have two sets of output data on this clutch system. The first one, EstimationData, will be used for parameter estimation and the other one, ValidationData, for validating the response of the Simulink model with the estimated parameters.
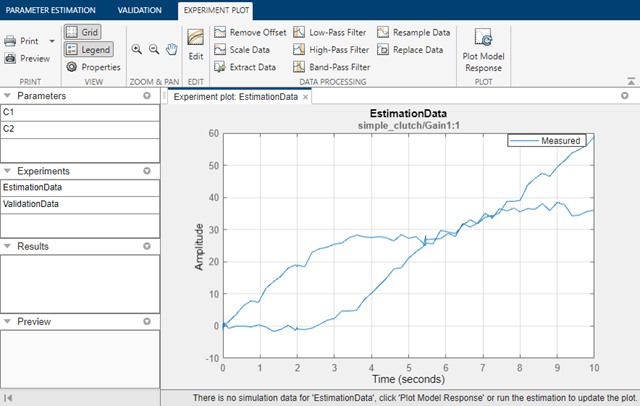
In the first experiment the clutch pressure follows the profile of Signal 1 supplied by the Clutch Pressure block in the Simulink model. This signal applies a ramp-up and a ramp-down pressure on the clutch plates. Click Add Plot in the Parameter Estimation UI, and select EstimationData to view the output velocities of the inertias in response to this input. Such data sets could also be imported from various sources including MATLAB® variables, MAT files, Excel® files, or comma-separated-value files.
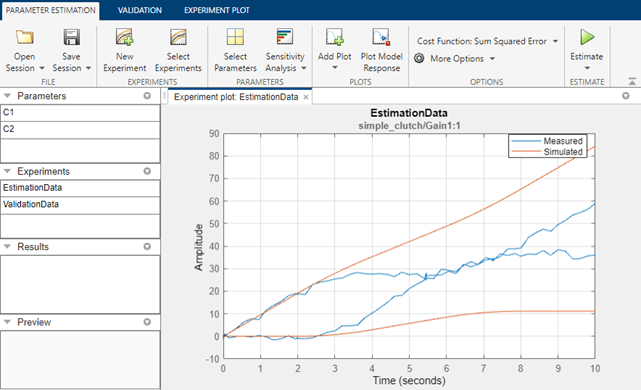
The parameter values for the friction coefficients are not known accurately. Clicking Plot Model Response provides a look at the response of this system, and shows that it does not match the experimental data, hence the parameters need to be estimated for a better fit.
Setting up and Running the Estimation
We will use the experimental data set EstimationData to estimate friction parameters of the clutch system.
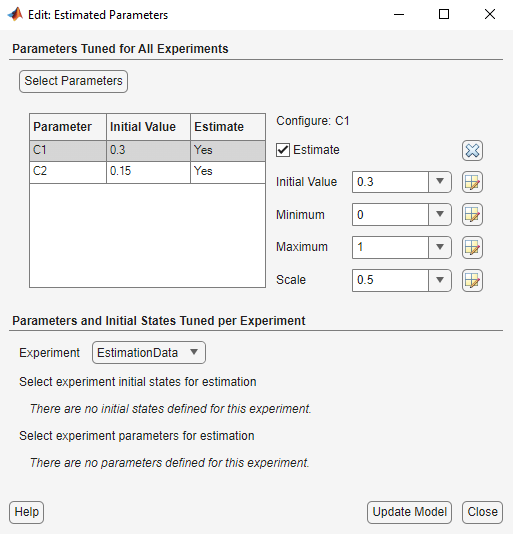
The first step is to define the variables to be estimated. This establishes which parameters of the simulation can be adjusted, and any rules governing their values. Click Select Parameters to specify parameters to be estimated. Here we want to estimate the friction coefficients C1 and C2 in the Controllable Friction Clutch block of the Simulink model. In the pre-loaded parameter estimation example, these parameters have already been specified for estimation. If there are known bounds on the parameter values, they can be set in the minimum and maximum fields.
Next, click Select Experiments to specify which experiments are to be used for estimation. It is possible to use one or more data sets at once in a given estimation. For our example, we will use the data set called EstimationData.
You are now ready to run the estimation. Click Estimate to start the estimation process. We provide a number of estimation methods, including nonlinear least-squares minimization, gradient descent, pattern search, or simplex search. Running estimation will vary the model parameters in order to reduce the error between the simulation outputs and the experimental data. During estimation, the experiment plot showing measured data and simulation response will updated. As the parameter values improve, the simulation curve should get closer to the experimental data curve. Also, a trajectory plot will show the parameter values at each iteration. These curves should reach steady-state as the parameter values get closer to their physical values.
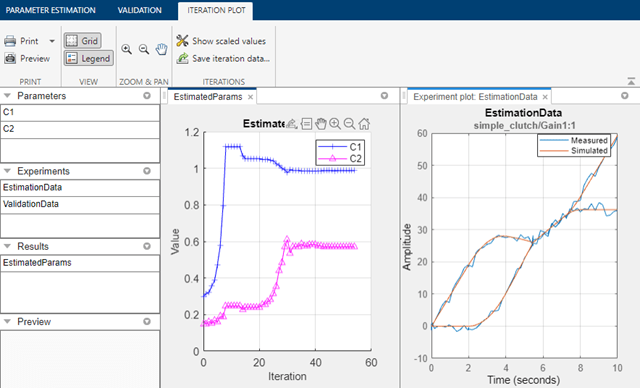
In addition, the table in the Estimation Progress Report will show data regarding the estimation process such as the number of iterations, the number of simulations, and the cost function. The cost function value represents the degree of fit between the simulation response and the estimation data. This value would decrease at each iteration, indicating the amount of improvement in the fit.
Validation
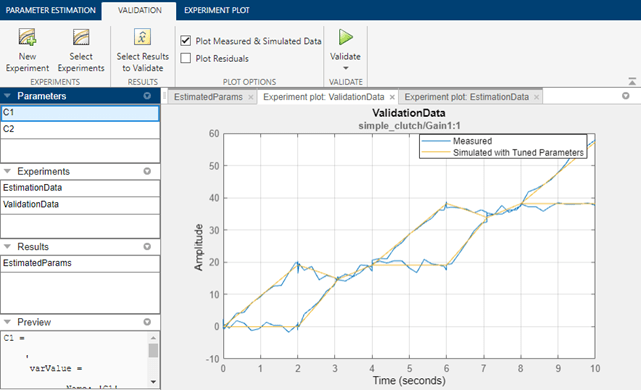
Once we complete the estimation, it is important to validate the results against other data sets. A successful estimation should be able to not only match the experimental data that we used for estimation, but also the other data sets that we collected in our experiments.
In the second set of experimental data we have for the clutch system, the clutch pressure follows the profile of Signal 2 supplied by the Clutch Pressure block in the Simulink model. This signal applies a periodic pressure on the clutch plates. To use this, first double-click on the Manual Switch block to change the input signal to the one used for validation data (Signal 2). Then in the Parameter Estimation UI, click the Validation tab, click Select Experiments and select the experiment ValidationData for validation. This contains output data corresponding to input from Signal 2. Finally, click Validate to carry out the validation. An experiment plot will compare the simulation response against experimental data. We see that the match is very good.
In summary, we have carried out estimation by specifying an experiment with measured output data, and designating certain parameters to be estimated. We then checked the parameter values by validating with a different data set, giving confidence in the parameter values.