Plot and Analyze Data
Why Plot the Data Before Parameter Estimation
After you import the estimation data as described in Import Data for Parameter Estimation, you can remove outliers, smooth, detrend, or otherwise treat the data to prepare for analysis and estimation. To view and analyze data characteristics, plot the data on a time plot.
Plot Data
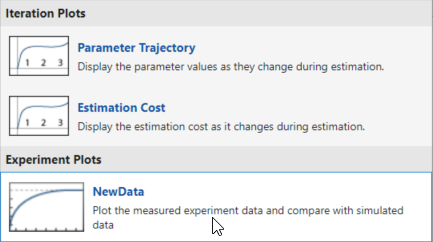
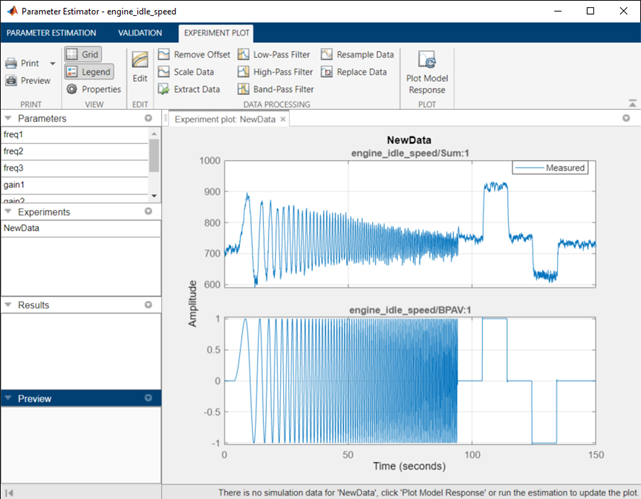
Use an experiment plot to visualize experiment data. First, create an experiment and import data as described in Import Data for Parameter Estimation. To create an experiment plot, in the Parameter Estimator, on the Parameter Estimation tab, click Add Plot. Then, under Experiment Plots, select the entry for your experiment data, for example NewData.
This creates plots of the input signal for the Inport block
BPAV and output signal for the Outport block Engine
Speed for the engine_idle_speed model (see Create Experiment).
You can also plot the experiment data by right-clicking the experiment data in the data browser and selecting Plot measured experiment data from the list.
Using the time plot, you can examine the data characteristics such as noise, outliers and portions of the data to use for estimating parameters. After you analyze the data, you can preprocess it as described in Preprocess Data.