Monitoraggio dell’attività del grafico tramite l’utilizzo dei dati sullo stato attivo
Se il grafico Stateflow® include dati correlati alla gerarchia del grafico, è possibile semplificare il progetto utilizzando i dati sullo stato attivo. Abilitando i dati sullo stato attivo, è possibile:
Evitare di aggiornare manualmente i dati che riflettono l'attività del grafico.
Registrare e monitorare l'attività del grafico in Simulation Data Inspector (Controllo dei dati di simulazione).
Utilizzare i dati dell'attività del grafico per controllare altri sottosistemi.
Esportare i dati dell'attività del grafico in altri blocchi Simulink.
Ad esempio, in questo modello di semaforo, lo stato attivo determina il valore del segnale di output color. È possibile semplificare la progettazione del grafico abilitando i dati sullo stato attivo. In questo caso, il grafico Stateflow può fornire il colore del semaforo tracciando l'attività di stato; quindi, non è necessario aggiornare esplicitamente il valore di color.

Per abilitare i dati sullo stato attivo, selezionare uno stato da monitorare. Quindi, nel Property Inspector (Controllo delle proprietà):
1. Selezionare Create output for monitoring (Creare l'output per il monitoraggio).
2. Selezionare uno di questi tipi di attività:
Self activity: valore booleano che indica se lo stato è attivoChild activity: valore enumerato che indica quale stato figlio è attivoLeaf state activity: valore enumerato che indica quale stato leaf è attivo
3. Inserire il Data name (Nome dati) per il simbolo dei dati sullo stato attivo.
4. Facoltativamente, per Child activity o Leaf state activity, inserire l'Enum name (Nome enumeratore) per il tipo di dati sullo stato attivo.
Per impostazione predefinita, i grafici Stateflow riportano l'attività dello stato come dati di output nel modello di Simulink. Per cambiare l'ambito di un simbolo di dati sullo stato attivo in dati locali, utilizzare il riquadro Symbols (Simboli).
Modellazione del controller di un semaforo
Questo esempio utilizza i dati sullo stato attivo per modellare il sistema controller di una coppia di semafori.

All'interno del grafico Traffic Controller, due grafici secondari paralleli gestiscono la logica che controlla i semafori. I grafici secondari hanno una gerarchia identica composta da tre stati figli: Red, Yellow e Green. I dati di output Light1 e Light2 corrispondono agli stati figli attivi nei grafici secondari. Questi segnali:
Determinano la fase dei semafori animati.
Contribuiscono al numero di automobili in attesa a ogni semaforo.
Guidano un sottosistema di asserzione di sicurezza che verifica che i due semafori non siano mai verdi contemporaneamente.
Per vedere i grafici secondari all'interno del grafico controller del traffico, fare clic sulla freccia nell'angolo in basso a sinistra del grafico.

Ogni controller del traffico passa ciclicamente attraverso i suoi stati figli, da Red a Green, a Yellow e di nuovo a Red. Ogni stato corrisponde a una fase del ciclo del semaforo. I segnali di output Light1 e Light2 indicano quale stato è attivo in un determinato momento.
Luce rossa
Il ciclo del semaforo inizia nel momento in cui lo stato Red diventa attivo. Dopo un breve intervallo, il controller verifica la presenza di automobili in attesa all'incrocio. Se rileva almeno un'automobile o se trascorre un periodo di tempo prestabilito, il controller richiede la luce verde impostando greenLightRequest su true. Dopo aver effettuato la richiesta, il controller rimane nello stato Red per un breve periodo di tempo finché non rileva che l'altro semaforo è rosso. A questo punto il controller effettua la transizione a Green.
Luce verde
Quando lo stato Green diventa attivo, il controller annulla la richiesta di luce verde impostando greenLightRequest su false. Il controller imposta greenLightLocked su true, impedendo all'altro semaforo di diventare verde. Dopo un breve intervallo, il controller verifica la presenza di una richiesta di luce verde da parte dell'altro controller. Se riceve una richiesta o se trascorre un periodo di tempo prestabilito, il controller passa allo stato Yellow.
Luce gialla
Quando lo stato Yellow diventa inattivo, il controller imposta greenLightLocked su falso, indicando che l'altro semaforo può diventare verde. Il controller rimane nello stato Yellow per un periodo di tempo prestabilito prima di passare allo stato Red. A questo punto il ciclo del semaforo riprende.
Tempistica dei semafori
La tempistica del ciclo dei semafori è definita da diversi parametri. Per modificare la tempistica dei semafori, fare doppio clic sul grafico Traffic Controller e inserire i nuovi valori per questi parametri nella finestra di dialogo:
REDDELAY: durata di tempo prima che il controller inizi a verificare la presenza di automobili all'incrocio. Questo valore rappresenta inoltre il tempo minimo prima che il semaforo diventi verde dopo che il controller ha richiesto il verde. Il valore predefinito è 6 secondi.MAXREDDELAY: durata massima di tempo in cui il controller verifica la presenza di auto prima di richiedere la luce verde. Il valore predefinito è 360 secondi.GREENDELAY: durata massima di tempo in cui il semaforo rimane verde. Il valore predefinito è 180 secondi.MINGREENDELAY: durata minima di tempo in cui il semaforo rimane verde. Il valore predefinito è 120 secondi.YELLOWDELAY: durata di tempo in cui il semaforo rimane giallo. Il valore predefinito è 15 secondi.
Analisi dell'esempio
Aprire il grafico facendo clic sulla freccia nell'angolo in basso a sinistra.
Nel riquadro Symbols (Simboli), selezionare
greenLightRequested. Quindi, nel Property Inspector (Controllo delle proprietà), sotto Logging (Registrazione), selezionare Log signal data (Registra dati segnale).Ripetere il passaggio precedente per
greenLightLocked,Light1eLight2.Nella scheda Simulation (Simulazione), fare clic su Run (Esegui).
Nella scheda Simulation (Simulazione), sotto Review Results (Revisiona risultati), fare clic su Data Inspector (Controllo dei dati).
In Simulation Data Inspector (Controllo dei dati di simulazione), visualizzare i segnali registrati in assi separati. I segnali booleani
greenLightRequestedegreenLightLockedappaiono come valori numerici di zero o uno. I segnali di attività di statoLight1eLight2sono enumerati con valori diGreen,Yellow,RedeNone.
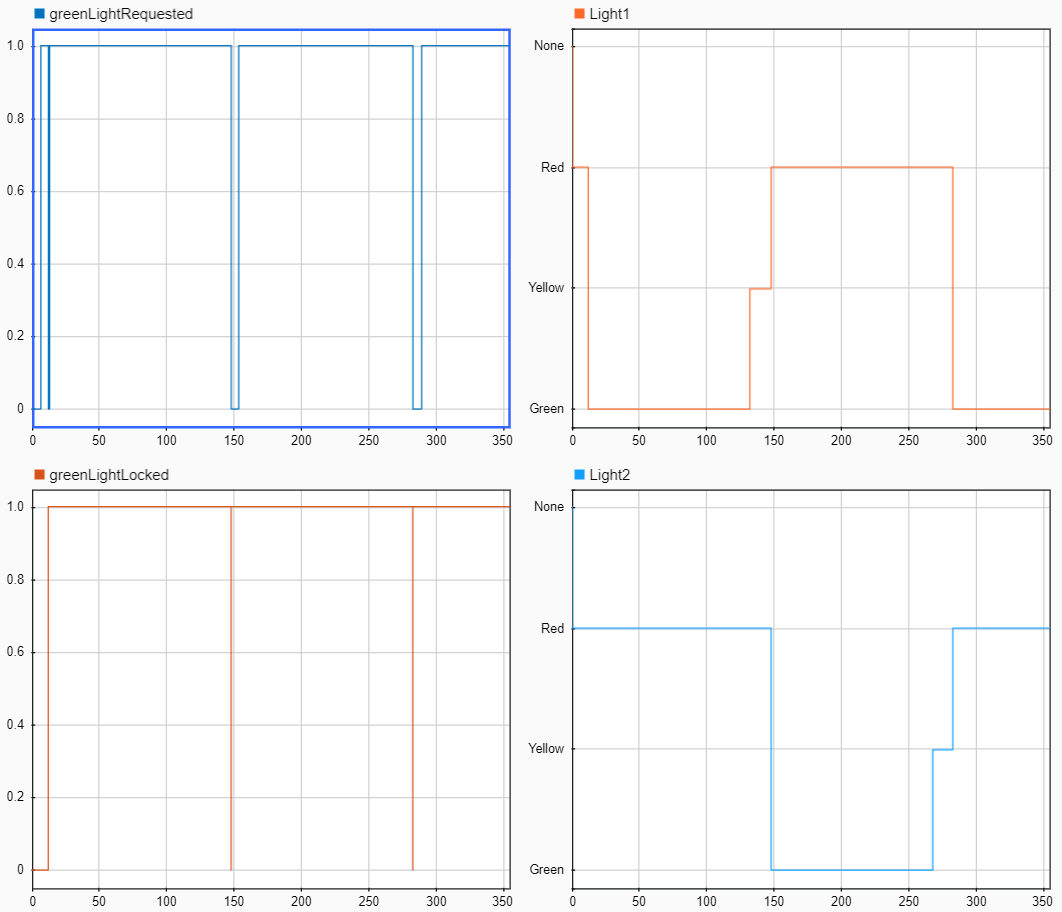
Per tracciare l'attività del grafico durante la simulazione, è possibile utilizzare i pulsanti di zoom e cursore in Simulation Data Inspector (Controllo dei dati di simulazione). Ad esempio, questi sono i momenti chiave durante i primi 300 secondi della simulazione:
 : all'inizio della simulazione, entrambi i semafori sono rossi.
 Light1eLight2sonoRed,greenLightRequestedèfalseegreenLightLockedèfalse. : dopo 6 secondi, ossia il valore predefinito di
 REDDELAY, sono presenti automobili in attesa su entrambe le strade, quindi entrambi i semafori richiedono il verde.Light1eLight2sono ancoraRed,greenLightRequestedètrueegreenLightLockedèfalse. : dopo ulteriori 6 secondi, ossia il valore predefinito di
 REDDELAY, Light 1 diventa verde, cancella la richiesta del verde e impostagreenLightLockedsutrue. Successivamente, Light 2 richiede il verde.Light1èGreen,Light2èRed,greenLightRequesteddiventa primafalsee poitrueegreenLightLockedètrue. : dopo 120 secondi, ossia il valore predefinito di
 MINGREENDELAY, Light 1 diventa giallo.Light1èYellow,Light2èRed,greenLightRequestedètrueegreenLightLockedètrue. : dopo 15 secondi, ossia il valore predefinito di
 YELLOWDELAY, Light 1 diventa rosso e impostagreenLightLockedsufalse. Quindi, Light 2 diventa verde, cancella la richiesta del verde e impostagreenLightLockedsutrue.Light1èRed,Light2èGreen,greenLightRequestedèfalseegreenLightLockeddiventa primafalsee poitrue. : dopo 6 secondi, ossia il tempo predefinito di
 REDDELAY, Light 1 richiede il verde.Light1èRed,Light2èGreen,greenLightRequestedètrueegreenLightLockedètrue. : dopo che Light 2 è rimasto verde per 120 secondi, ossia il valore predefinito di
 MINGREENDELAY, Light 2 diventa giallo.Light1èRed,Light2èYellow,greenLightRequestedètrueegreenLightLockedètrue. : dopo 15 secondi, ossia il valore predefinito di
 YELLOWDELAY, Light 2 diventa rosso e impostagreenLightLockedsufalse. Quindi, Light 1 diventa verde, cancella la richiesta del verde e impostagreenLightLockedsutrue.Light1èGreen,Light2èRed,greenLightRequestedèfalseegreenLightLockeddiventa primafalsee poitrue. : dopo 6 secondi, ossia il tempo predefinito di
 REDDELAY, Light 2 richiede il verde.Light1èGreen,Light2èRed,greenLightRequestedètrueegreenLightLockedètrue.
Il ciclo si ripete finché la simulazione non termina a ![]() secondi.
secondi.