Analyze Impact of Specific Words on Text Classification
R2026bThis example shows you how to analyze the impact of specific words on the predictions of a text classification model.
When you classify text using a deep learning model, it can be difficult to understand which words drive the model toward a particular classification. One solution is to use Shapley values to measure the contribution of each word to the final prediction.
This example shows how to compute Shapley values for for a Bidirectional Encoder Representations from Transformer (BERT) document classifier. The Shapley value for a specific word measures how much that word changes the prediction score of the model. To compute this value, you compare the prediction score when the word is present against the score when the word is removed. Because the effect of a word can depend on which other words are in the sentence, you can repeat this comparison across all possible subsets of the remaining words and then average the results. The Shapley value of that word is then the average difference in the prediction score of the model with and without that word, across all possible combinations of the other words in the sentence. However, this calculation is computationally expensive because of the large number of combinations. In this example, you approximate the Shapley values by randomly sampling a fixed number of combinations.
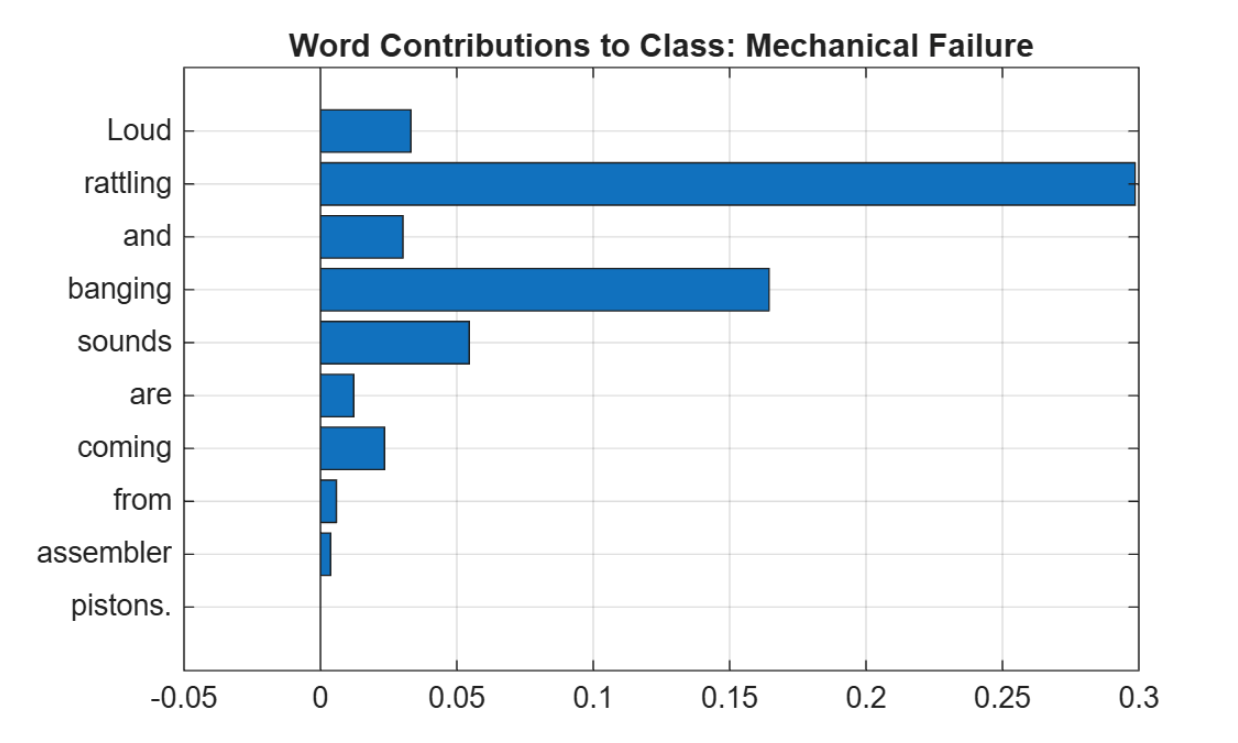
This figure illustrates the contribution of individual words to the prediction score of a selected class, as measured by their Shapley values.
Load Training Data
To compute Shapley values, you need text data and a classification model trained on that data. If you have your own, you can use them directly. Otherwise, use the factoryReports CSV file and a BERT model trained on it, both provided with this example.
Load the training data from the factoryReports CSV file. The file contains a data set of 480 factory incident reports. Each row logs an equipment problem with a free-text description and a corresponding failure category (Mechanical, Electronic, Leak, or Software).
filename        = "factoryReports.csv";
tbl             = readtable(filename,TextType="string");
head(tbl)
                                 Description                                       Category          Urgency          Resolution         Cost
    _____________________________________________________________________    ____________________    ________    ____________________    _____

    "Items are occasionally getting stuck in the scanner spools."            "Mechanical Failure"    "Medium"    "Readjust Machine"         45
    "Loud rattling and banging sounds are coming from assembler pistons."    "Mechanical Failure"    "Medium"    "Readjust Machine"         35
    "There are cuts to the power when starting the plant."                   "Electronic Failure"    "High"      "Full Replacement"      16200
    "Fried capacitors in the assembler."                                     "Electronic Failure"    "High"      "Replace Components"      352
    "Mixer tripped the fuses."                                               "Electronic Failure"    "Low"       "Add to Watch List"        55
    "Burst pipe in the constructing agent is spraying coolant."              "Leak"                  "High"      "Replace Components"      371
    "A fuse is blown in the mixer."                                          "Electronic Failure"    "Low"       "Replace Components"      441
    "Things continue to tumble off of the belt."                             "Mechanical Failure"    "Low"       "Readjust Machine"         38
Convert the labels in the Category column of the table to categorical values and view the number of classes in the data.
textData = tbl.Description;
labels = categorical(tbl.Category);
classNames = categories(labels);
numClasses = numel(classNames)
numClasses =
4
Load Trained BERT Document Classifier
Train a BERT document classifier on the factory reports data set by using the function trainAndSaveDocumentClassifier, which is attached to this example as a supporting file. For details on how to train the BERT document classifier on a data set, see Train BERT Document Classifier.
trainAndSaveDocumentClassifier;
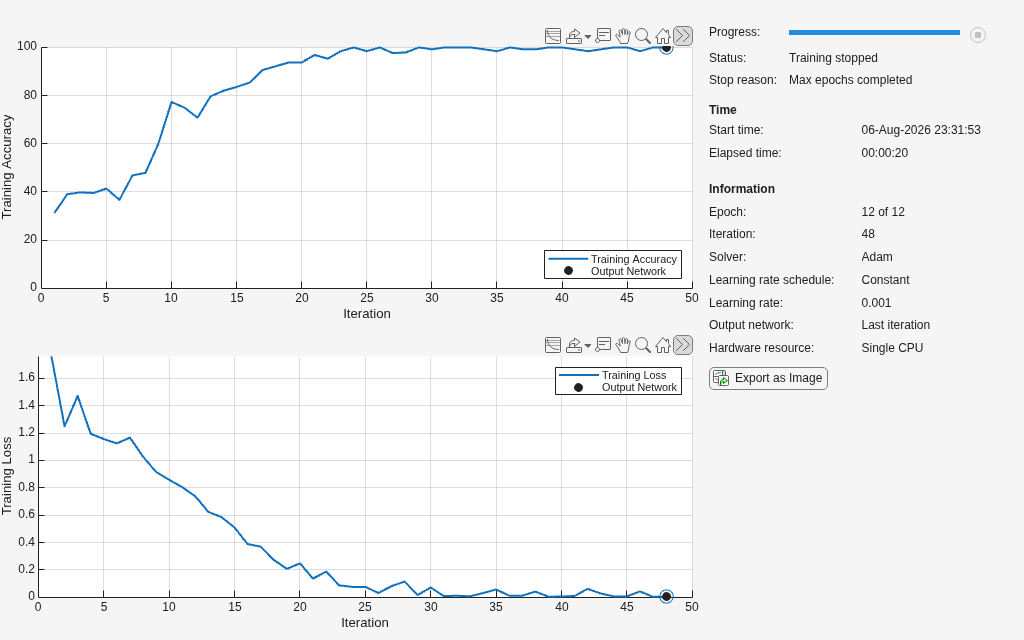
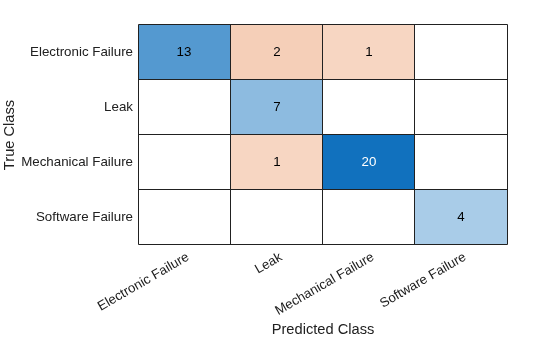
Extract the network and the tokenizer from the BERT document classifier. The network is the trained deep learning model, and the tokenizer preprocesses text into the token identifiers that the network requires as input.
net = mdl.Network;
tokenizer = mdl.Tokenizer;
Choose Example Sentence to Analyze
Choose a sentence from the data set to analyze. Split the text into individual words.
inputIdx = 2;
txt = textData(inputIdx);
txtWords = split(txt)';
numTokensInSentence = numel(txtWords);
disp(txtWords)
"Loud" "rattling" "and" "banging" "sounds" "are" "coming" "from" "assembler" "pistons."
Classify this sentence using the BERT document classifier.
categoryName = string(classify(mdl, txt))
categoryName =
"Mechanical Failure"
The classifier classifies this sentence as a mechanical failure. To understand which words drive this prediction, compute the Shapley values.
Set Parameters for Shapley Value Calculation
Set parameters for Shapley value calculation.
The number of samples determines how accurate the approximation is. More samples improve accuracy, but increase computation time.
The batch size determines how fast predictions are processed. A higher batch size improves speed, but increases memory usage.
numSamples = 1000;
batchSize = 100;
The Shapley algorithm requires a representative data set, called the background data set, from which to sample words. Use the entire data set as the background data set.
txtWordsSampling = cell(size(textData));
for i = 1:numel(textData)
    txtWordsSampling{i} = split(textData(i))';
end
Generate Word Combinations and BERT Prediction Scores
To calculate exact Shapley values, you must compute the average difference in the prediction score of the model with and without that word, across all possible combinations of the other words in the sentence, but that is expensive. This section approximates this calculation by randomly sampling a fixed number of combinations.
First, initialize B1Set and B2Set to store the different word combinations. Also, initialize Y1 and Y2 to store the corresponding BERT prediction scores.
B1Set = string.empty;
B2Set = string.empty;
Y1 = [];
Y2 = [];
For each word in the sentence, create two random word combinations, B1 and B2. For the combination B1, start with the original sentence, shuffle the words randomly, and then replace all words that come after the current word in the ordering with random words from the background data set. To create the combination B2, copy B1, and replace the current word with a random background word.
For example, consider the sentence "Generator blew fuse". Shuffle the words to the order [blew, fuse, Generator]. For the first word "blew", replace all words in the shuffled sentence that come after the word "blew" to create B1. For the combination B2, also replace the word "blew". For example, the combination B1 would be [word_1, blew, word_2], and B2 would be [word_1, word_3, word_2]. The words word_1, word_2, and word_3 are randomly sampled from the background data set txtWordsSampling.
Collect all of the word combinations B1 and B2 in B1Set and B2Set, respectively. When the for-loop collects a number of samples equal to batchSize, process them in a batch by calling getScoreFromBERT, which is attached to this example as a supporting function. The getScoreFromBERT function takes a dlnetwork, a BERT tokenizer, and the array of strings as inputs. The function then outputs prediction scores of the input string arrays from the BERT network to the variables Y1 and Y2.
for wordIdx = 1:numTokensInSentence
    fprintf("Processing word %d of %d: '%s'\n", wordIdx, numTokensInSentence, txtWords{wordIdx});

    B1 = strings(numSamples, 0);
    B2 = strings(numSamples, 0);

    allWordsToSample = cat(2, txtWordsSampling{:});

    for sampleIdx = 1:numSamples

        tokenIndices = randi(numel(allWordsToSample), [1, numTokensInSentence]);
        randomWords = allWordsToSample(tokenIndices);

        randomPermutation = randperm(numTokensInSentence);

        randomPosition = find(randomPermutation == wordIdx);

        succeedingEntries = randomPermutation((randomPosition+1):end);

        b1 = txtWords;
        b1(:, succeedingEntries) = randomWords(:, succeedingEntries);

        b2 = b1;
        b2(:, wordIdx) = randomWords(:, wordIdx);

        B1(sampleIdx) = string(join(b1));
        B2(sampleIdx) = string(join(b2));
    end

    B1Set = [B1Set; B1'];
    B2Set = [B2Set; B2'];

    if size(B1Set, 1) >= batchSize
        Y1 = [Y1 getScoreFromBERT(net, tokenizer, B1Set)];
        B1Set = string.empty;
    end
    if size(B2Set, 1) >= batchSize
        Y2 = [Y2 getScoreFromBERT(net, tokenizer, B2Set)];
        B2Set = string.empty;
    end
end
Processing word 1 of 10: 'Loud'
Processing word 2 of 10: 'rattling'
Processing word 3 of 10: 'and'
Processing word 4 of 10: 'banging'
Processing word 5 of 10: 'sounds'
Processing word 6 of 10: 'are'
Processing word 7 of 10: 'coming'
Processing word 8 of 10: 'from'
Processing word 9 of 10: 'assembler'
Processing word 10 of 10: 'pistons.'
Process any remaining samples that did not fill a complete batch.
if ~isempty(B1Set)
    Y1 = [Y1 getScoreFromBERT(net, tokenizer, B1Set)];
end
if ~isempty(B2Set)
    Y2 = [Y2 getScoreFromBERT(net, tokenizer, B2Set)];
end
Calculate Shapley Values
Calculate Shapley values as the difference between predictions with and without each word. This difference Y1 - Y2 represents the contribution of each word for each sample.
shapleyValuesForSamples = Y1 - Y2;
Reshape the values into a 3-D array with dimensions [numClasses, numSamples, numTokensInSentence], and compute the average contribution across all samples to get the final Shapley values.
shapleyValuesForSamples = reshape(shapleyValuesForSamples, ...
    [numClasses, numSamples, numTokensInSentence]);
values = mean(shapleyValuesForSamples, 2);
values = reshape(values, [numClasses, numTokensInSentence]);
values = extractdata(values);

if canUseGPU
    values = gpuArray(values);
end
Visualize Shapley Values
Get the Shapley values for the predicted class. If the values are stored on a GPU, the gather function transfers them back to the CPU for display.
classOfInterest = labels(inputIdx);
valuesForClass = gather(values(double(classOfInterest), :));
T = table(txtWords(:), valuesForClass(:), ...
    VariableNames=["Word", "ShapleyValue"]);
disp(T)
       Word        ShapleyValue
    ___________    ____________

    "Loud"            0.033177
    "rattling"         0.29862
    "and"             0.030256
    "banging"          0.16445
    "sounds"          0.054546
    "are"             0.012197
    "coming"          0.023496
    "from"           0.0058461
    "assembler"      0.0037555
    "pistons."     -0.00012086
Create a horizontal bar plot that shows the contribution of each word to the mechanical failure prediction. To create the plot, use the shapleyPlot function, which is attached to this example as a supporting file.
shapleyPlot(valuesForClass, split(txt))
title("Word Contributions to Class: " + string(classOfInterest)); 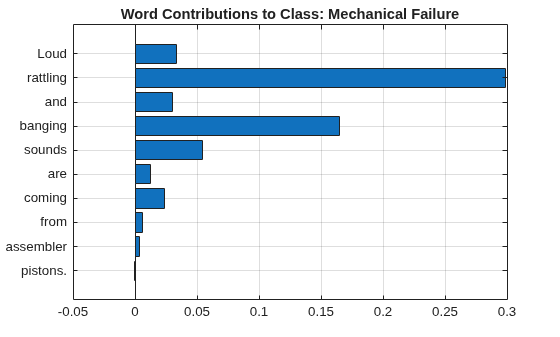
The visualization shows that the words "rattling" and "banging" contribute most strongly to the classification as "Mechanical Failure". This makes sense because unusual rattling and banging noises are common indicators of wear, misalignment, or damage in mechanical components. The words "and", "from", and, "are" have small contributions, which is expected because they are common words that do not carry specific meaning related to mechanical failures.
See Also
trainBERTDocumentClassifier | dlnetwork (Deep Learning Toolbox) | bert | bertTokenizer

