Simulate Wind Turbulence Using CETI Model
This example shows you how to simulate the effect of wind turbulence on a quadrotor UAV, flying at low speed or hovering, by using the Control Equivalent Turbulence Input (CETI) model. Under such flight conditions, you cannot use the Dryden or Von Karman turbulence models because both models assume that the UAV flies through a frozen wind turbulence field.
Create Simulated Flight Data
This example estimates the parameters of the CETI model by using simulated flight data. To generate the simulated flight data, this example uses the ExampleQuadrotorCETI.slx Simulink® model.

The model simulates a closed-loop system with quadrotor plant dynamics and a velocity controller. The quadrotor plant receives a wind disturbance on the longitudinal axis while in the hover condition.
Similar to the CETI model, ExampleQuadrotorCETI.slx models the wind turbulence as a disturbance added to the control input of the UAV plant [1]. The Simulink model generates the disturbance by passing white noise through a filter defined by this transfer function.
Specify a signal sample rate, wind disturbance time period, and the and parameters, which are the numerator and denominator coefficients of the filter transfer function, respectively. You can use these values to create a ground truth wind model.
fs = 100;
dT = 1/fs;
Kw = 264;
aw = 0.351;
Create a linear model of the UAV plant by linearizing the longitudinal dynamics equation of the Guidance Model block during the hover condition with a yaw angle of zero.
where:
is the gravitational acceleration in meters per second squared.
and are the pitch response parameters of the Guidance Model block.
is the input pitch angle in radians.
g = 9.81;
Kp = 3402.97;
Kd = 116.67;
Represent the linearized equation as a state space model:
where:
is the forward velocity in meters per second.
is the pitch rate in rad/s.
is the pitch angle in radians.
A = [g  0   0;
     0 -Kd -Kp;
     0  1   0];
B = [0; Kp; 0];
C = eye(3);
D = zeros(3,1);
Generate the frequency response of the linearized UAV plant.
[bPlant,aPlant] = ss2tf(A,B,C,D);
sysPlant = tf(bPlant(2,:),aPlant);
[magPlant,phasePlant,wPlant] = bode(sysPlant,{1e-1 pi*fs/2});
Generate the frequency response of the ground truth wind model.
windModel = tf(Kw,[1 aw]);
[magWind,phaseWind,wWind] = bode(windModel,{1e-1 pi*fs/2});
Run the model, and obtain the frequency responses of the control signal, wind disturbance signal, and plant state pitch angular rate signal.
out = sim("ExampleQuadrotorCETI.slx");
% Control input signal generated by velocity controller.
c = out.logsout.getElement("data").Values.c;
pcc = pwelch(squeeze(c.Data),[],[],wPlant/fs);

% Wind disturbance added to the control signal.
w = out.logsout.getElement("data").Values.w;
pww = pwelch(squeeze(w.Data),[],[],wPlant/fs);

% State output signal from plant.
q = out.logsout.getElement("data").Values.q;
pqq = pwelch(squeeze(q.Data),[],[],wPlant/fs);
Obtain the frequency response of the wind disturbance that you extracted from the state output and control input by using this equation [1].
pwwExtracted = 1./squeeze(magPlant).^2.*pqq-pcc;
Plot and compare the frequency responses of the extracted wind disturbance, simulated wind disturbance, and the ground truth wind model.
figure
semilogx(wPlant,10*log10(abs(pwwExtracted)))
hold on
semilogx(wPlant,10*log10(abs(pww)),"--")
hold on
semilogx(wWind,2*10*log10(abs(squeeze(magWind))),"-")
legend(["Extracted Wind Disturbance","Simulated Wind Disturbance","Ground Truth Wind Model"])
xlabel("Frequency [rad/s]")
ylabel("Magnitude [dB]")
![Figure contains an axes object. The axes object with xlabel Frequency [rad/s], ylabel Magnitude [dB] contains 3 objects of type line. These objects represent Extracted Wind Disturbance, Simulated Wind Disturbance, Ground Truth Wind Model.](../../examples/uav/win64/SimulateTurbulenceEffectOnQuadrotorUsingCETIExample_02.png)
Estimate CETI Wind Model Parameters
Estimate the parameters of the wind model transfer function by using the frequency response of the extracted wind disturbance and tfest function of System Identification Toolbox™.
frdata = idfrd(sqrt(abs(pwwExtracted)),wPlant,1/fs);
frdata = addMinPhase(frdata,1/fs);
sys = tfest(frdata, 1);
Compare the frequency responses of the estimated wind model against those of the ground truth wind model.
[magWindEst,phaseWindEst,wWindEst] = bode(sys,{1e-1 pi*fs/2});
figure
semilogx(wWindEst,2*10*log10(abs(squeeze(magWindEst))),"--");
hold on
semilogx(wWind,2*10*log10(abs(squeeze(magWind))),"-");
legend(["Estimated", "Ground truth"])
xlabel("Frequency [rad/s]")
ylabel("Magnitude [dB]")![Figure contains an axes object. The axes object with xlabel Frequency [rad/s], ylabel Magnitude [dB] contains 2 objects of type line. These objects represent Estimated, Ground truth.](../../examples/uav/win64/SimulateTurbulenceEffectOnQuadrotorUsingCETIExample_03.png)
Simulate Turbulence Effect on UAV
Simulate the model using the estimated wind model parameters.
Kw = sys.Numerator(1);
aw = sys.Denominator(2);
out = sim("ExampleQuadrotorCETI.slx");
Obtain the frequency response of the wind disturbance signal.
w = out.logsout.getElement("data").Values.w;
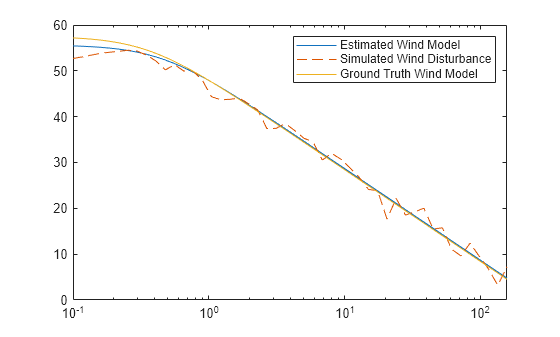
pww = pwelch(squeeze(w.Data),[],[],wPlant/fs);Plot and compare the frequency responses of the estimated wind model, simulated wind disturbance, and the ground truth wind model.
figure
semilogx(wPlant,2*10*log10(abs(squeeze(magWindEst))));
hold on
semilogx(wPlant,10*log10(abs(pww)),"--");
hold on
semilogx(wWind,2*10*log10(abs(squeeze(magWind))),"-");
legend(["Estimated Wind Model","Simulated Wind Disturbance","Ground Truth Wind Model"])
Using Flight Log Data
This example demonstrates how to estimate the parameters of the CETI turbulence model by using simulated data. However, you can use flight log data for the estimation process instead. For more details on flight log requirements, such as duration and the state estimation signal-to-noise ratio, see [1].
References
[1] Juhasz, Ondrej, Mark J. S. Lopez, Marcos G. Berrios, Tom Berger, and Mark Tischler. "Turbulence Modeling of a Small Quadrotor UAS Using System Identification from Flight Data." 2017.