findPointsInModel
Description
Examples
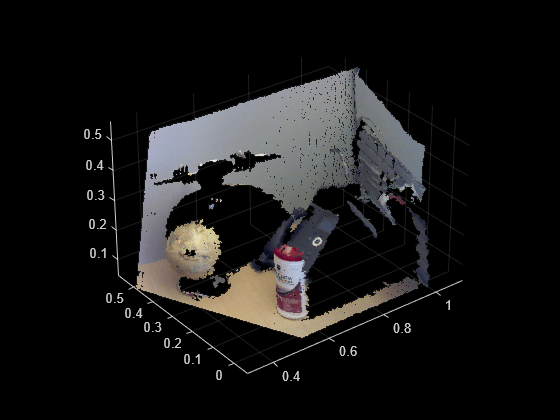
Load a MAT file containing point cloud data into the workspace.
load("object3d.mat")Visualize the point cloud.
figure
pcshow(ptCloud)

Define a region of interest (ROI) in the point cloud in which to detect a cylinder model.
roi = [0.4 0.7; -0.1 0.2; 0 0.4];
sampleIndices = findPointsInROI(ptCloud,roi);
Set a maximum point-to-cylinder distance of 5 mm for cylinder fitting and the orientation constraint.
maxDistance = 0.005;
referenceVector = [0 0 1];
Detect a cylinder in the point cloud.
 model = pcfitcylinder(ptCloud,maxDistance,referenceVector, ...
        SampleIndices=sampleIndices);
Create a synthetic point cloud that is evenly distributed and covers the region of interest.
gridStep = 0.005;
[x,y,z] = meshgrid(roi(1,1):gridStep:roi(1,2),roi(2,1):gridStep:roi(2,2), ...
roi(3,1):gridStep:roi(3,2));
syntheticPtCloud = pointCloud([x(:) y(:) z(:)],Color=[0.7 0.7 0.8]);
Find the points in the synthetic point cloud that are in the cylinder.
idx = findPointsInModel(model,syntheticPtCloud);
cylinderPtCloud = select(syntheticPtCloud,idx);
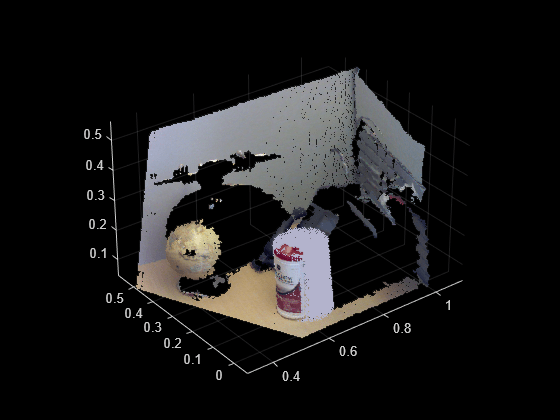
Visualize the resulting point cloud, with the synthetic points in the cylinder modeling the object on the table.
figure
pcshow(cylinderPtCloud)
hold on
pcshow(ptCloud)
Load a MAT file containing a point cloud into the workspace.
load("object3d.mat")Visualize the point cloud.
figure
pcshow(ptCloud)

Define a region of interest (ROI) in the point cloud in which to detect a sphere model.
roi = [0.2 0.55; 0.2 0.5; 0 0.5];
sampleIndices = findPointsInROI(ptCloud,roi);
Set a maximum point-to-sphere distance of 5mm for sphere fitting.
maxDistance = 0.005;
Detect the sphere in the point cloud.
[model,inlierIdx] = pcfitsphere(ptCloud,maxDistance,SampleIndices=sampleIndices);
Find one of the colors in the detected sphere, to use for the synthetic point cloud.
inlierPtCloud = select(ptCloud,inlierIdx);
color = median(inlierPtCloud.Color);
Create a synthetic point cloud that is evenly distributed and covers the region of interest.
gridStep = 0.005;
[x,y,z] = meshgrid(roi(1,1):gridStep:roi(1,2),roi(2,1):gridStep:roi(2,2), ...
roi(3,1):gridStep:roi(3,2));
syntheticPtCloud = pointCloud([x(:) y(:) z(:)],Color=color);
Find the points in the synthetic point cloud that are in the sphere.
idx = findPointsInModel(model,syntheticPtCloud);
spherePtCloud = select(syntheticPtCloud,idx);
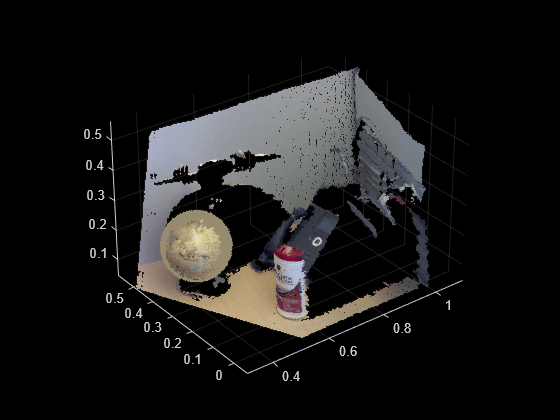
Visualize the resulting point cloud, with the synthetic points in the sphere modeling the object on the table.
figure
pcshow(spherePtCloud)
hold on
pcshow(ptCloud)
Input Arguments
Parametric model, specified as a cylinderModel or sphereModel object.
Point cloud in the sensor coordinate system, specified as a pointCloud object.
Output Arguments
Linear indices of the point cloud points that are located inside or on the surface of the model, returned as a column vector.
Version History
Introduced in R2024a
MATLAB Command
You clicked a link that corresponds to this MATLAB command:
Run the command by entering it in the MATLAB Command Window. Web browsers do not support MATLAB commands.
Seleziona un sito web
Seleziona un sito web per visualizzare contenuto tradotto dove disponibile e vedere eventi e offerte locali. In base alla tua area geografica, ti consigliamo di selezionare: .
Puoi anche selezionare un sito web dal seguente elenco:
Come ottenere le migliori prestazioni del sito
Per ottenere le migliori prestazioni del sito, seleziona il sito cinese (in cinese o in inglese). I siti MathWorks per gli altri paesi non sono ottimizzati per essere visitati dalla tua area geografica.
Americhe
- América Latina (Español)
- Canada (English)
- United States (English)
Europa
- Belgium (English)
- Denmark (English)
- Deutschland (Deutsch)
- España (Español)
- Finland (English)
- France (Français)
- Ireland (English)
- Italia (Italiano)
- Luxembourg (English)
- Netherlands (English)
- Norway (English)
- Österreich (Deutsch)
- Portugal (English)
- Sweden (English)
- Switzerland
- United Kingdom (English)