Compute Standard Deviation of ROIs
This example shows how to compute the standard deviation of regions-of-interest (ROIs) in the input image. The input image is composed of different texture regions and ROIs are selected to contain these texture regions.
Read an image into the MATLAB® workspace.
I = imread('multitextures.png');
Load the mask image that specifies the ROIs in the input image.
load('binaryROI.mat')
Example Model
Open the Simulink model.
modelname='ex_blk2dstd.slx';
open_system(modelname);
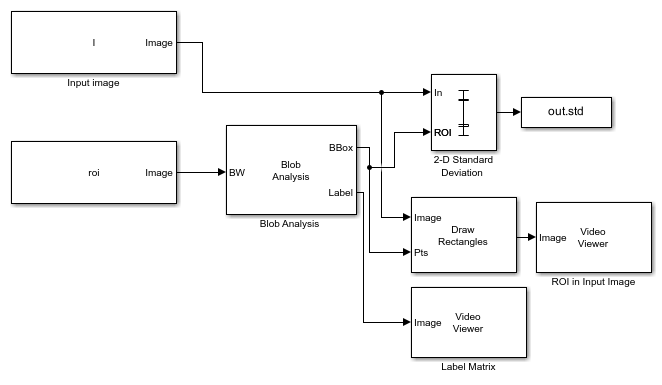
The model computes the coordinates for the ROIs by using the Blob Analysis block. The maximum number of blobs parameter in the Blob Analysis block is set to 5, the number of ROIs.
The 2-D Standard Deviation block computes the standard deviation value for each ROI.
Set these parameters of the 2-D Standard Deviation block to the specified value inorder to compute individual statistics for each ROI.
Set
Find the standard deviation value overparameter toEntire inputSelect
Enable ROI processingparameterSet
ROI typeparameter toRectanglesSet
Outputparameter toIndividual statistics for each ROI
Simulate and Display Results
The values of the standard deviation indicate the dispersion of the pixel values in ROI from the corresponding mean value.
out = sim(modelname);
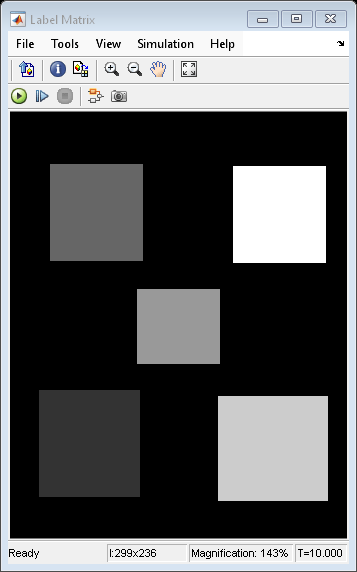
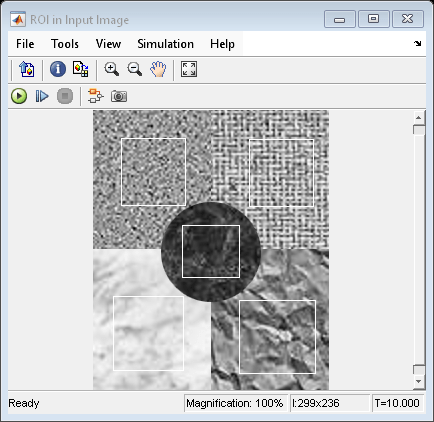
The model also displays the input image and the label matrix that correspond to the selected ROIs. The rectangles overlaid on the input image represents the ROIs for which the standard deviation is computed.
Display the standard deviation value for each ROI. The first standard deviation value correspond to the region with label value 1. Similarly, the second standard deviation value correspond to the region with label value 2 and so on.
out.std
ans =

    0.0534
    0.1203
    0.0775
    0.1463
    0.1629