Continuous Wavelet Analysis of Modulated Signals
This example shows how to use the continuous wavelet transform (CWT) to analyze modulated signals.
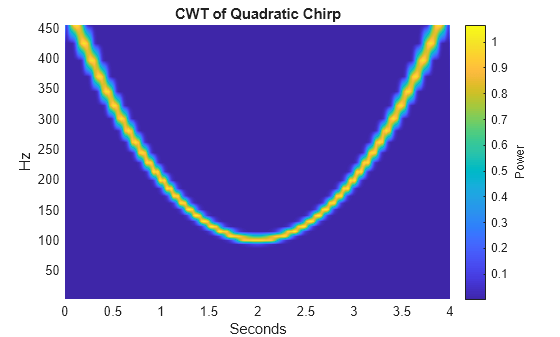
Load a quadratic chirp signal. The signal's frequency begins at approximately 500 Hz at t = 0, decreases to 100 Hz at t=2, and increases back to 500 Hz at t=4. The sampling frequency is 1 kHz.
load quadchirp;
fs = 1000;
Obtain a time-frequency plot of this signal using the CWT with a bump wavelet. The bump wavelet is a good choice for the CWT when your signals are oscillatory and you are more interested in time-frequency analysis than localization of transients.
[cfs,f] = cwt(quadchirp,'bump',fs);
helperCWTTimeFreqPlot(cfs,tquad,f,'surf','CWT of Quadratic Chirp','Seconds','Hz')

The CWT clearly shows the time evolution of the quadratic chirp's frequency. The quadratic chirp is a frequency-modulated signal. While that signal is synthetic, frequency and amplitude modulation occur frequently in natural signals as well. Use the CWT to obtain a time-frequency analysis of an echolocation pulse emitted by a big brown bat (Eptesicus Fuscus). The sampling interval is 7 microseconds. Use the bump wavelet with 32 voices per octave. Thanks to Curtis Condon, Ken White, and Al Feng of the Beckman Center at the University of Illinois for the bat data and permission to use it in this example.
load batsignal
t = 0:DT:(numel(batsignal)*DT)-DT;
[cfs,f] = cwt(batsignal,'bump',1/DT,'VoicesPerOctave',32);
helperCWTTimeFreqPlot(cfs,t.*1e6,f./1e3,'surf','Bat Echolocation (CWT)',...
    'Microseconds','kHz')

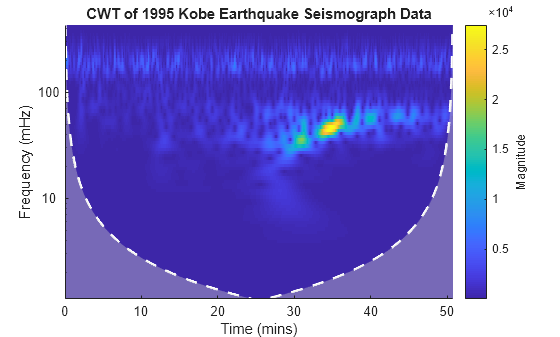
For the final example, obtain a time-frequency analysis of some seismograph data recorded during the 1995 Kobe earthquake. The data are seismograph (vertical acceleration, nm/sq.sec) measurements recorded at Tasmania University, Hobart, Australia on 16 January 1995 beginning at 20:56:51 (GMT) and continuing for 51 minutes at 1 second intervals. Use the default analytic Morse wavelet.
load kobe;
dt = 1;
cwt(kobe,1);
title('CWT of 1995 Kobe Earthquake Seismograph Data');
