nodePositionRandom
Syntax
Description
The nodePositionRandom function randomly generates node positions
within a specified region. You can define this region using a boundary shape and dimensions, a
given polygon, or the intersection of two boundaries. This function enables you distribute
serving nodes, such as next generation NodeB (gNB), access points (AP), or Central nodes,
across a broad area. At the same time, it restricts served nodes, such as user equipment (UE)
nodes, Station nodes, or Peripheral nodes, to the intersection of coverage zones. For more
information about how to simulate this scenario, see the Randomly Place Wireless Nodes in Polygon and Visualize Placement example.
Generate Random Node Positions within Specified Boundary Shape and Dimensions
[
generates a single random position within the specified boundary shape and dimensions.
nodePosition,polygonShapeOut] = nodePositionRandom(boundaryShape,boundaryDimension)
[
specifies the node position configuration parameters using one or more optional name-value
arguments. nodePosition,polygonShapeOut] = nodePositionRandom(boundaryShape,boundaryDimension,Name=Value)
Generate Random Node Positions within Specified Polygon
[
generates a single random node position within the specified polygon
nodePosition,polygonShapeOut] = nodePositionRandom(polygonShapeIn)polygonShapeIn.
[
specifies the node position configuration parameters using one or more optional name-value
arguments. Note that the nodePosition,polygonShapeOut] = nodePositionRandom(polygonShapeIn,Name=Value)Center name-value argument does not apply
when you use this syntax.
Generate Random Node Positions within Boundary Intersections
[
specifies the parent boundary details nodePosition,polygonShapeOut] = nodePositionRandom(polygonShapeIn,boundaryShape,boundaryDimension)polygonShapeIn. The function
considers two boundaries, one from the parent boundary and another defined by the
boundaryShape and boundaryDimension arguments,
and generates a single random node position exclusively in the area where these two
boundaries intersect. Note that the output argument polygonShapeOut
is a polyshape
object representing the intersection of the parent boundary
polygonShapeIn and the boundary defined by
boundaryShape and boundaryDimension.
[
specifies the node position configuration parameters using one or more optional name-value
arguments. For example, nodePosition,polygonShapeOut] = nodePositionRandom(polygonShapeIn,boundaryShape,boundaryDimension,Name=Value)ZCoordinate=3.5 sets the
z-coordinate of all node positions to 3.5 meters.
Examples
Generate and visualize the random placement of wireless nodes within a rectangular area. Using the nodePositionRandom function, you distribute ten nodes uniformly inside a 100-by-100 meter region. Then, a wirelessNetworkViewer object displays the resulting node positions.
Set the area dimensions and number of nodes.
areaLength = 100;           % Rectangle length (meters)
areaWidth = 100;            % Rectangle width (meters)
numNodes = 10;              % Number of random nodes
Generate random node positions in the rectangle.
[nodePositions,rectPoly] = nodePositionRandom( ...
    "rectangle",[areaLength areaWidth],NumNodes=numNodes);
View the positions using the wireless network viewer.
viewer = wirelessNetworkViewer(CanvasSize=[200 200]);
addNodes(viewer,nodePositions,Type="RandomNodePositions")
Show the rectangle boundary.
showBoundary(viewer, ...
    Position=[0 0 0], ...
    BoundaryShape="rectangle", ...
    Bounds=[areaLength areaWidth], ...
    Name="RectangleBoundary")

Remove the node position by uncommenting this line of code.
% removeNodes(viewer)Hide the rectangle boundary by uncommenting this line of code.
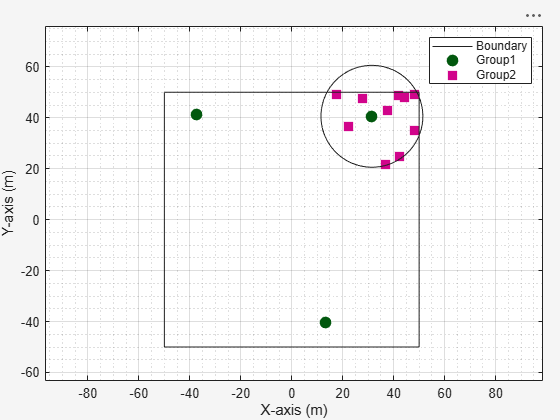
% hideBoundary(viewer)Use the nodePositionRandom function to randomly place two groups of wireless nodes: you distribute the first group within a 100-by-100 meter rectangle, and then place the second group within the intersection of that rectangle and a 20-meter radius circle centered at the first node of the first group.
Define the size of the rectangle, the number of nodes in each group, and the radius of the circle.
areaSize = [100 100];        % Rectangle size (meters)
numGroup1Nodes = 3;          % Number of nodes in the first group (rectangle)
circleRadius = 20;           % Circle radius (meters)
numGroup2Nodes = 10;         % Number of nodes in the second group (intersection)
Randomly distribute the first group of nodes within the 100-by-100 meter rectangle.
[group1Positions, parentBoundaryPolygon] = nodePositionRandom("rectangle",areaSize,NumNodes=numGroup1Nodes);Randomly place the second group of nodes within the intersection of the rectangle and a 20-meter radius circle centered at the first node of group 1.
[group2Positions,intersectBoundaryPolygon] = nodePositionRandom( ...
    parentBoundaryPolygon,"circle",circleRadius, ...
    Center=group1Positions(1,:),NumNodes=numGroup2Nodes);
Create a wireless network viewer.
viewer = wirelessNetworkViewer;
Add the first group of nodes, from the rectangle, to the viewer.
addNodes(viewer,group1Positions,Type="Group1")Add the second group of nodes, from the intersection of rectangle and circle, to the viewer.
addNodes(viewer,group2Positions,Type="Group2")Show the rectangle boundary.
showBoundary(viewer, ...
    Position=[0 0 0], ...
    BoundaryShape="rectangle", ...
    Bounds=areaSize, ...
    Name="RectangleBoundary", ...
    Tag="RectangleTag")
Show the intersection circle boundary.
showBoundary(viewer, ...
    Position=[group1Positions(1,1), group1Positions(1,2), 0], ...
    BoundaryShape="circle", ...
    Bounds=circleRadius, ...
    Name="IntersectionCircle", ...
    Tag="CircleTag")
This approach applies to various wireless network scenarios:
5G Networks: Assign the first group of nodes as base stations ( gNBs) and the second group as user equipment ( UEs). Place UEs within the coverage area of a gNB, using constraints to create realistic deployments.
WLAN (Wi-Fi) Networks: Use the first group for Access Points and the second group for Stations. Position Stations within both the building (rectangle) and the signal range (circle) of an Access Point.
Bluetooth Networks: Set the first group as Central devices and the second group as Peripherals. Place Peripherals within the communication range of a Central device.
Generate random positions for wireless nodes inside polygon. Define the polygon with four vertices to create an irregular quadrilateral region. Use the nodePositionRandom function to distribute nodes uniformly within the polygon. Visualize and explore the resulting network deployment with wirelessNetworkViewer.
Define a quadrilateral polygon.
pgon = polyshape([0 0 1 3], [0 3 3 0]);
Generate random node positions within this polygon.
numNodes = 10;
[nodePosition,polygonShapeOut] = nodePositionRandom(pgon,NumNodes=numNodes);
Visualize the node placements by using a wireless network viewer.
viewer = wirelessNetworkViewer(CanvasSize=[10 10]);
addNodes(viewer,nodePosition,Type="Node Positions")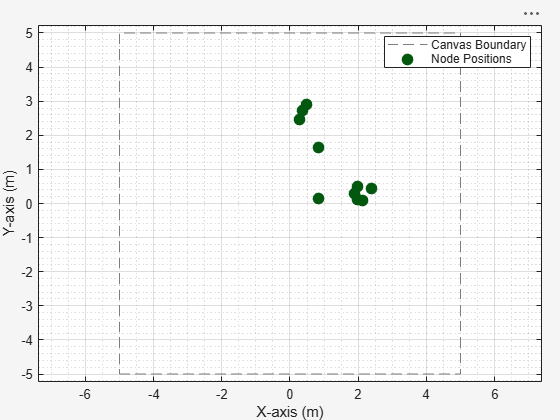
Input Arguments
Name-Value Arguments
Output Arguments
Version History
Introduced in R2026a