Main Content

plotThreshold

Plot preamble detection signals for triggering

Since R2022a

Description

example

plotThreshold(pd,length) plots preamble detection signals while detecting a preamble in live data of length length from the air using the preamble detector 
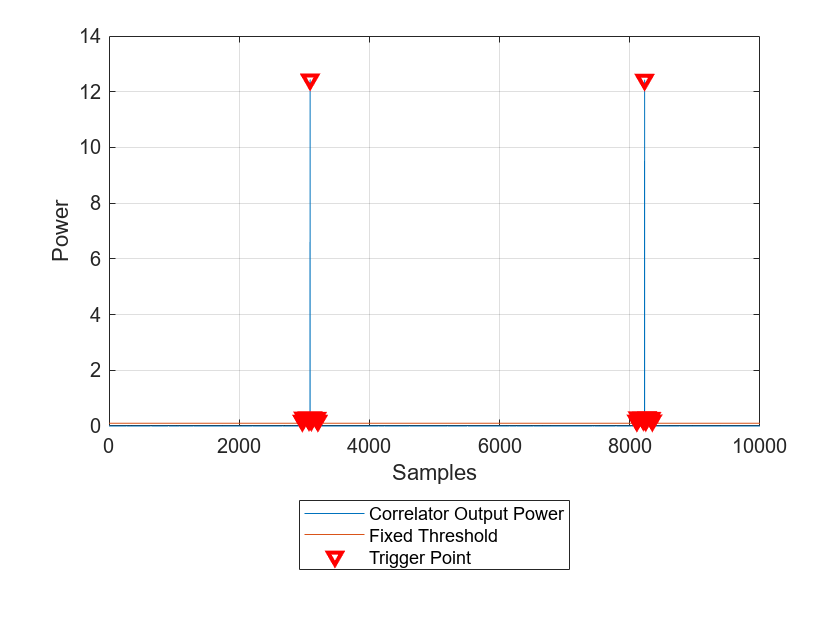
pd. The plot shows the correlator output power, threshold, and trigger points of the detection. Use the displayed information to calibrate the threshold in the preamble detector for triggering.

droppedSamples = plotThreshold(pd,length) returns the status information of dropped samples, in addition to plotting preamble detection signals.

Examples

collapse all

Define a preamble sequence with good correlation properties. For example, generate and normalize a Zadoff-Chu sequence of length 137.

zcseq = zadoffChuSeq(38,137);
preamble = zcseq/norm(zcseq,2); 

Create and configure a preamble detector object, specifying a radio setup configuration previously saved in the Radio Setup wizard.

pd = preambleDetector("MyRadio")
pd = 
  preambleDetector with properties:

            CenterFrequency: 2.4000e+09
                  RadioGain: 10
                   Antennas: "RF0:RX2"
                 SampleRate: 250000000
            CaptureDataType: "int16"
       DroppedSamplesAction: "error"
                   Preamble: [16×1 double]
            ThresholdMethod: "adaptive"
             FixedThreshold: 0
    AdaptiveThresholdOffset: 0
      AdaptiveThresholdGain: 0
              TriggerOffset: 0

pd.SampleRate = 30.72e6;
pd.RadioGain = 30;

Specify the preamble.

pd.Preamble = preamble;

Specify a fixed threshold.

pd.ThresholdMethod = "Fixed";
pd.FixedThreshold = 0.1;

Generate test waveform for detection.

prePadLen = 2501;
postPadLen = 2500;
headSignal = complex(zeros(prePadLen,1),zeros(prePadLen,1));
rearSignal = complex(zeros(postPadLen,1),zeros(postPadLen,1));              
testWaveform = [headSignal; zcseq*0.75; rearSignal]; 

Send the test waveform continuously.

transmit(pd,testWaveform,"continuous", ...
    TransmitGain=30);

Plot the specified number of samples of the correlator output power. Use the displayed information to calibrate thresholding parameters.

plotThreshold(pd,10000);

Figure contains an axes object. The axes object with xlabel Samples, ylabel Power contains 3 objects of type line. One or more of the lines displays its values using only markers These objects represent Correlator Output Power, Fixed Threshold, Trigger Point.

Stop test waveform transmission.

stopTransmission(pd);

Input Arguments

collapse all

Preamble detector, specified as a preambleDetector object.

Note

The first object function call in which you specify this object as an input requires a few extra seconds to load the application onto the hardware.

Plotted data length, specified as an integer number of samples or a duration value in time units. The function converts length into N samples based on the pd.SampleRate property and plots ceil(N) number of data samples.

Specify the plotted data length relative to the onboard radio memory buffer size.

Radio DeviceMemory Buffer SizeMaximum Data Samples

USRP™ N310

2 GB229

USRP N320

2 GB229

USRP N321

2 GB229

USRP X310

1 GB228

USRP X410

4 GB230

Note

Plotted and transmit data samples are buffered in the onboard radio memory. Therefore, when specifying the plotted data length, you must also take into account the length of the transmit waveform of any continuous transmission that you specify when calling the transmit object function with the pd input.

Example: seconds(5)

Data Types: double | duration

Output Arguments

collapse all

Status of dropped samples, returned as one of these logical values.

  • 1 — Samples are dropped while plotting the signals.

  • 0 — Samples are not dropped while plotting the signals.

Use the DroppedSamplesAction property of the pd input to specify the behavior of the plotThreshold function upon dropped samples.

Data Types: logical

Version History

Introduced in R2022a

See Also

Objects

Functions