How to add different shaded Color to the back ground of a graph?
Mostra commenti meno recenti
a = 0:0.1:2*pi;
b = sin(a);
plot(a,b)
i have written a simple code of sin wave.. i want to add diffrent background colours to different regions or bands.. for example 0-2 some colour, 2-4 some other colour.. as shown in a picture added with this question.
i have tried "area" & "Fill" function but not getting desired results.


Risposta accettata
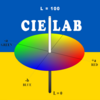
Image Analyst
il 15 Ago 2023
1 voto
1 Commento

taimour sadiq
il 16 Ago 2023

Più risposte (0)
Categorie
Scopri di più su 2-D and 3-D Plots in Centro assistenza e File Exchange
il 15 Ago 2023
il 16 Ago 2023
Community Treasure Hunt
Find the treasures in MATLAB Central and discover how the community can help you!
Start Hunting!
Translated by