Hi, could I take alook at your code? I got a similar issue
Gaussian Peaks in Plotted Data
14 visualizzazioni (ultimi 30 giorni)
Mostra commenti meno recenti
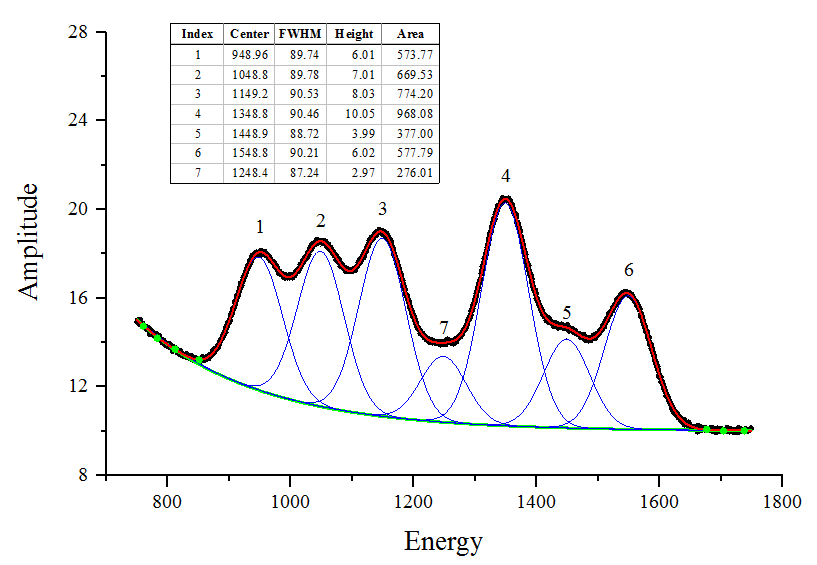
I want to find gaussian peaks in my plotted data and not just the local maxima peaks. 'findpeaks' won't work because it thinks that my x values aren't increasing monotonically. Also, findpeaks is just for the local maxima. I want to fit each peak with a Gaussian curve and transpose it onto my plotted data. Is there a tolbox or command I can use to easily find these peaks? I want to make a graph like the attached.
Risposta accettata
Più risposte (0)
Vedere anche
Community Treasure Hunt
Find the treasures in MATLAB Central and discover how the community can help you!
Start Hunting!
Translated by ![]()
Puoi anche selezionare un sito web dal seguente elenco:
Americhe
- América Latina (Español)
- Canada (English)
- United States (English)
Europa
- Belgium (English)
- Denmark (English)
- Deutschland (Deutsch)
- España (Español)
- Finland (English)
- France (Français)
- Ireland (English)
- Italia (Italiano)
- Luxembourg (English)
- Netherlands (English)
- Norway (English)
- Österreich (Deutsch)
- Portugal (English)
- Sweden (English)
- Switzerland
- United Kingdom(English)
Asia-Pacifico
- Australia (English)
- India (English)
- New Zealand (English)
- 中国
- 日本Japanese (日本語)
- 한국Korean (한국어)