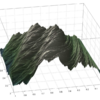
Why when I try to LLSQ fit to a quadratic the line of best fit has so many lines
Mostra commenti meno recenti
Below is the code for a quadratic fit im trying to do, but the figure that is created (attached as an image) has an insane amount of lines running through it. Im assuming its because of the 'bo-', but I need the fit line to be connected. I cant have it all dots. The data is from a data sheet.
x = valuesx
y = valuesy
figure(1)
plot(x,y, 'r+')
hold on
nx = length(x);
for(i=1:nx)
A(i,:)= [x(i)^2 x(i) 1]
end
A_LLSQ = A' *A;
y_LLSQ = A'*y;
Coeffs_Fit = A_LLSQ\y_LLSQ;
xx =x;
yy = (Coeffs_Fit(1).*xx.^2 + Coeffs_Fit(2).*xx + Coeffs_Fit(3));
plot(xx,yy,'bo-')
1 Commento
John D'Errico
il 8 Nov 2020
Modificato: John D'Errico
il 8 Nov 2020
The random lines that you see are the result of data that is not sorted in x. So plot connects each point to the next one in the list. And since your data is not sorted, you get a random looking mess.
David has given you the solution with linspace.

Risposta accettata
Più risposte (0)
Categorie
Scopri di più su Interpolation in Centro assistenza e File Exchange
Community Treasure Hunt
Find the treasures in MATLAB Central and discover how the community can help you!
Start Hunting!