


- /
-
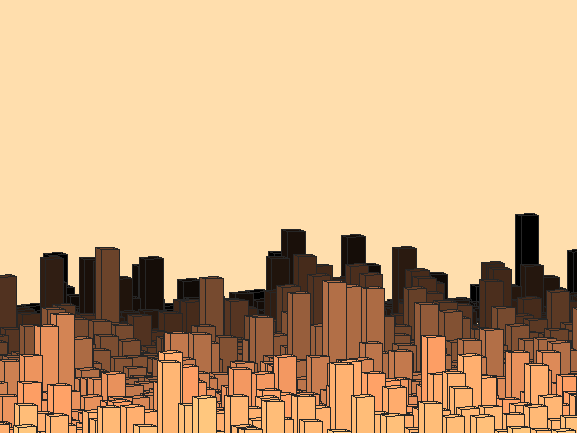
City sunrise - bird view
on 11 Oct 2021
- 26
- 105
- 0
- 0
- 192
figure(Color='w')
axes(Color=[1 .87 .68])
hold on
colormap copper
camva(2)
view([9.5,-3,1])
h=randg(1,60)*0.8; % building heights
h(:,[3:8:60])=0;
h([3:8:60],:)=0;
b=bar3(h);
axis equal
box off
set(gca,'ytick',[],'ZLim',[0,15])
% g=.13; % height and width of windows
% [m,k]=ndgrid(1:25); % (x,y) building indices
% for i=1:10000 % loop through each building
% Interpolate building color according to building height
% Ideally this should be outside the loop but that would require more characters
% q=b(m(i));
% set(q,'CData',q.ZData,'FaceC','i');
% for j=1:2 % loop through each column of windows
% L=k(i)-.27+(j-1)*.37; % in k-a+(j-1)*b, a is the signed distance from center of building in row k(i) to left edge of window in column j and b is the interval between left edges of windows.
% x=L+[0,g,g,0]'; % [L;R;R;L] edges of windows in building i, window column j
% z=ones(4,1)*(.2:.4:h(i)-.2)+[0;0;g;g]; % 4xn height of windows for n levels of windows; in a:b:c a is height of first row of windows, b is the interval between window-bottoms, c is height of tallest window.
% y=z*0+m(i)+.4; % 4xn location of front face of building
%
% % Plot windows for building i, column j
% patch(z*0+x,y,z,'y');
% end
% end


