


- /
-
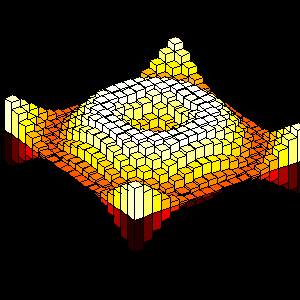
Sine Wave Generator
on 6 Nov 2023
- 17
- 186
- 1
- 6
- 1527
drawframe(1);
Write your drawframe function below
function drawframe(n)
Resolution = 19; %amount of pillars per row
StepSize = n/48;
x = linspace(0,2,Resolution);
[X,Y] = meshgrid(x);
Distance = sqrt((X-1).^2 + (Y-1).^2);
Height = 3*sin(pi*(Distance - StepSize)).^2;
ax = gca;
bar3c(Height)
hold(ax,'on')
bar3c(-Height)
hold(ax,'off')
colormap(hot)
camzoom(1.3)
ax.View = [-37.5 + n*90/48, 30];
ax.XLim = [0.5,Resolution+0.5];
ax.YLim = [0.5,Resolution+0.5];
ax.ZLim = [-ceil(Resolution/4),ceil(Resolution/4)];
ax.Color = 'k';
ax.XColor = 'k';
ax.YColor = 'k';
ax.ZColor = 'k';
fig = gcf;
fig.Color = 'k';
%%%%%%%%%%%%%%%%%%%%%%%%%%%%%%%% Not my code and dont know the source anymore. %%%%%%%%%%%%%%%%%%%%%%%%%%%%%%%%%%%%%%%%%%%%%%%%%%%%%%
function hh = bar3c( varargin )
%BAR3C Extension of bar3, which sets the bar color corresponding to its
%height.
%
% Extra parameter: 'MaxColorVal', maxclr
% This will make the color/height of the bar absolute against this maximum
% value. Otherwise, the colors will be relative against the maximum zdata
% value of all bars on the graph.
h = bar3(varargin{:},1);
for ii = 1:numel(h)
zdata = h(ii).ZData;
cdata = makecdata(zdata(2:6:end,2),NaN);
set(h(ii),'Cdata',cdata,'facecolor','flat');
end
if nargout>0
hh = h;
end
end
function cdata = makecdata(clrs,maxclr)
cdata = NaN(6*numel(clrs),4);
for ii=1:numel(clrs)
cdata((ii-1)*6+(1:6),:)=makesingle_cdata(clrs(ii));
end
if nargin>=2
% it doesn't matter that we put an extra value on cdata(1,1)
% this vertex is NaN (serves as a separator
cdata(1,1)=maxclr;
end
end
function scdata = makesingle_cdata(clr)
scdata = NaN(6,4);
scdata(sub2ind(size(scdata),[3,2,2,1,2,4],[2,1,2,2,3,2]))=clr;
end
end
Animation


