5G NR Waveform Capture and Analysis Using Software-Defined Radio
This example shows how to use the 5G Waveform Generator app to generate and transmit a standard-compliant 5G NR waveform continuously over the air using a software-defined radio (SDR). The example then shows how to capture the transmitted waveform from the air using an SDR and analyze the signal in MATLAB®.
Introduction
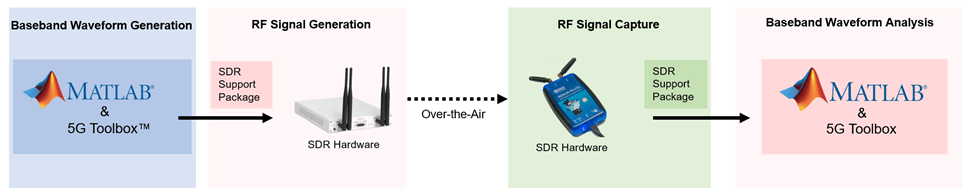
This diagram shows the main steps of the example.
Generate a baseband waveform by using the 5G Waveform Generator app.
Transmit the generated waveform over the air, directly from the app, by using a connected SDR hardware (requires an SDR support package).
Capture the over-the-air waveform in MATLAB by using another connected SDR hardware or the same SDR hardware (requires an SDR support package).
Analyze the PDCCH/PDSCH error vector magnitude (EVM) of the captured waveform in MATLAB.
To transmit and capture waveforms with SDRs, you must install the corresponding hardware support package. This list provides information on which radios can be used by this example along with the required products.
ADALM-PLUTO (requires Communications Toolbox Support Package for Analog Devices® ADALM-PLUTO Radio). For more information, see ADALM-Pluto Radio.
USRP™ 200 series (requires Communications Toolbox Support Package for USRP Radio). For more information, see USRP Radio and Supported Hardware and Required Software.
USRP E320, N3xx series, or X series (requires Wireless Testbench Support Package for NI™ USRP Radios). For more information, see Supported Radio Devices (Wireless Testbench).
USRP E310/E312 (requires Communications Toolbox Support Package for USRP Embedded Series Radio). For more information, see USRP Embedded Series Radio.
AD936x/FMCOMMS5 (requires SoC Blockset™ Support Package for AMD® FPGA and SoC Devices). For more information, see AMD FPGA and SoC Devices (SoC Blockset).
If you are using a USRP 200 series, E320, N3xx series, or X series radio, you must receive the transmitted signal using a second SDR and MATLAB session.
Generate Baseband Waveform
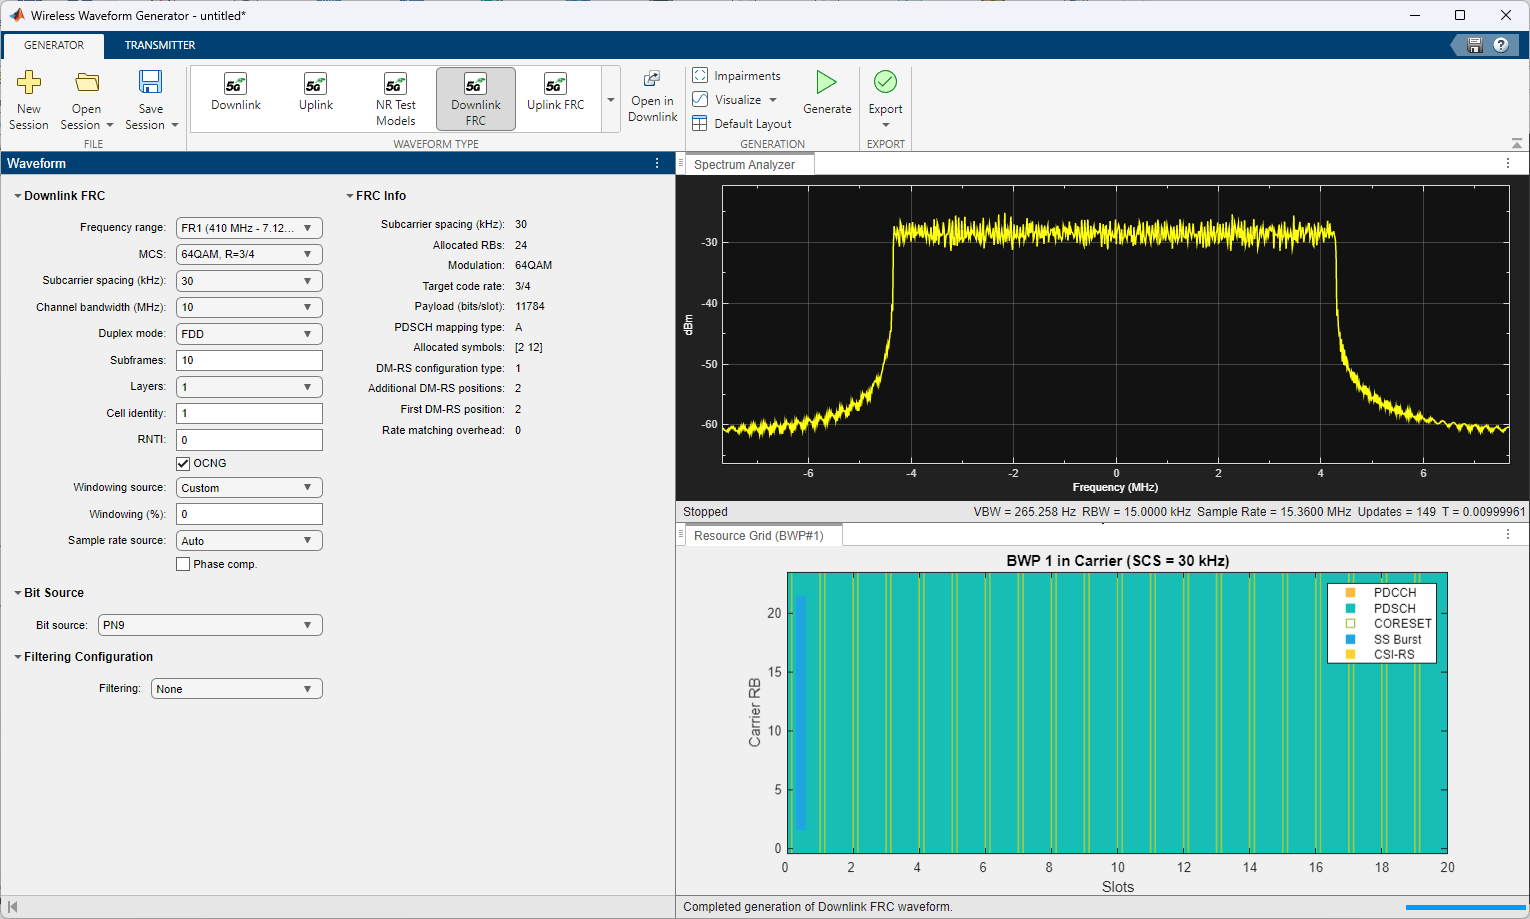
In MATLAB, on the Apps tab, click the 5G Waveform Generator app.
In the Waveform Type section, click Downlink FRC. In the leftmost pane of the app, you can set the parameters for the selected waveform. For this example:
Set Frequency range to
FR1 (410 MHz - 7.125 GHz).Set MCS to
64QAM, R=3/4.Set Subcarrier spacing (kHz) to
30.Set Channel bandwidth (MHz) to
10.Set Duplex mode to
FDD.Set RNTI to 0.
Select the OCNG check box.
On the app toolstrip, click Generate.
Transmit Generated Waveform
On the Transmitter tab of the app, in the Transmitter Type section, select your SDR for waveform transmission.
If you have an ADALM-PLUTO radio corresponding to the Communications Toolbox Support Package for Analog Devices ADALM-PLUTO Radio, select
Pluto.If you have a USRP E310 or E312 radio corresponding to the Communications Toolbox Support Package for USRP Embedded Series Radio, select
USRP E.If you have a AD936x or FMCOMMS5 radio corresponding to the SoC Blockset Support Package for AMD FPGA and SoC Devices, select
Zynq Based.If you have a USRP 200 series radio corresponding to the Communications Toolbox Support Package for USRP Radio, select
USRP E/B/N/X.If you have a USRP N3xx series or X series radio corresponding to the Wireless Testbench Support Package for NI USRP Radios, select your radio from the Radio Transmitter options.
If you have a USRP E320 radio corresponding to Wireless Testbench Support Package for NI USRP Radios, select
USRP E/B/N/X.
Specify your transmission parameters, such as Center frequency (Hz) and Gain (dB). The app automatically obtains the baseband sample rate from the generated waveform and performs any necessary oversampling. To start the transmission, click Transmit in the toolstrip.

Capture Transmitted Waveform
Set Up Receiver Processing Parameters
Set the downlink waveform parameters used in the app for receiver processing.
rc ="DL-FRC-FR1-64QAM"; % Reference channel bw =
"10MHz"; % Channel bandwidth scs =
"30kHz"; % Subcarrier spacing dm =
"FDD"; % Duplexing mode rnti =
0; % Radio network temporary identifier
Configure SDR Receiver Object
To capture the waveform that the app continuously transmits, create an hSDRReceiver helper object and then set the object properties. If you are using an NI USRP radio with Wireless Testbench, click Update and select your saved radio setup configuration.
Set
rx.CenterFrequencyto3.4e9, as specified in the Transmitter tab of the app.Set
rx.SampleRateto a value greater than or equal to the Transmitter sample rate (Hz) parameter value in the app.Set
rx.Gainto any valid value that provides a successful decode of the captured waveform. Valid values of gain include'AGC Fast Attack','AGC Slow Attack', or an integer value for the Zynq Based, USRP Embedded, or ADALM-PLUTO radios. USRP radios only support integer values.
deviceNameOptions = hSDRBase.getDeviceNameOptions;
% User-defined parameters
rx    = hSDRReceiver(deviceNameOptions(1)) ; % SDR receiver object
rx.CenterFrequency = 3.4e9;
rx.SampleRate      = 30.72e6;
rx.Gain            =  60;
Specify the number of contiguous 5G frames to capture. One frame equates to 10 milliseconds.
framesToCapture =1; % Derived parameters captureDuration = milliseconds(10)*(framesToCapture+1); % Increase capture frame by 1 to account for a full frame not being captured
Initiate Waveform Capture
Initiate a capture of the 5G NR waveform transmitted by the app.
rxWaveform = capture(rx,captureDuration);
## Establishing connection to hardware. This process can take several seconds.
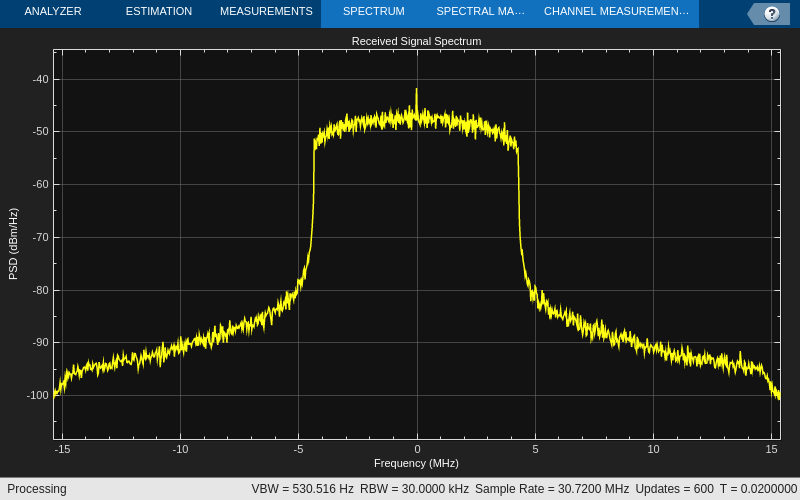
Plot the power spectral density (PSD) of the received signal.
spectrumPlotRx = spectrumAnalyzer;
spectrumPlotRx.SampleRate =  rx.SampleRate;
spectrumPlotRx.SpectrumType = "Power density";
spectrumPlotRx.YLabel = "PSD";
spectrumPlotRx.Title = "Received Signal Spectrum";
spectrumPlotRx(rxWaveform);
Measure EVM of Received Waveform
Generate and extract a nrDLCarrierConfig object for a specific test model (TM) or fixed reference channel (FRC) using the hNRReferenceWaveformGenerator helper file.
rcwavegen = hNRReferenceWaveformGenerator(rc,bw,scs,dm);
cfgDL = rcwavegen.Config;
Use the hNRDownlinkEVM function to analyze the waveform. In this example, the function performs these steps:
Estimates and compensates for any frequency offset
Estimates and corrects I/Q imbalance
Synchronizes the DM-RS over one frame for frequency division duplexing (FDD) or two frames for time division duplexing (TDD)
Demodulates the received waveform
Punctures the DC subcarrier component
Estimates the channel
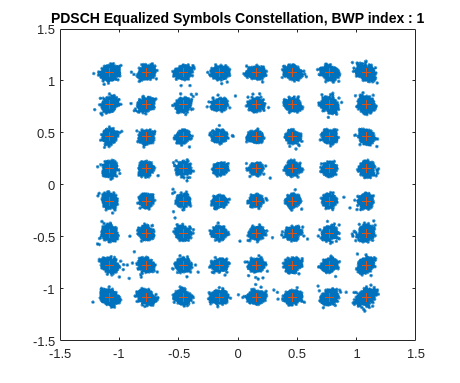
Equalizes the symbols
Estimates and compensates for common phase error (CPE)
Computes the physical downlink shared channel (PDSCH) EVM
Computes the physical downlink control channel (PDCCH) EVM
For more information on the hNRDownlinkEVM function, see the EVM Measurement of 5G NR Downlink Waveforms with RF Impairments example.
Define the configuration settings for the hNRDownlinkEVM function.
cfg = struct();
cfg.PlotEVM = true;             % Plot EVM statistics
cfg.DisplayEVM = true;          % Print EVM statistics
cfg.Label = rc;                 % Set to TM name of captured waveform
cfg.SampleRate = rx.SampleRate; % Use sample rate during capture
cfg.IQImbalance = true;
cfg.TargetRNTIs = rnti;
cfg.CorrectCoarseFO = true;
cfg.CorrectFineFO = true;
cfg.ExcludeDC = true;

[evmInfo,eqSym,refSym] = hNRDownlinkEVM(cfgDL,rxWaveform,cfg);
EVM stats for BWP idx : 1
PDSCH RMS EVM, Peak EVM, slot 1: 8.785 30.182%
DM-RS RMS EVM, Peak EVM, slot 1: 6.105 12.590%
PDSCH RMS EVM, Peak EVM, slot 2: 8.687 35.142%
DM-RS RMS EVM, Peak EVM, slot 2: 6.223 13.346%
PDSCH RMS EVM, Peak EVM, slot 3: 8.861 41.104%
DM-RS RMS EVM, Peak EVM, slot 3: 5.760 13.862%
PDSCH RMS EVM, Peak EVM, slot 4: 8.458 31.603%
DM-RS RMS EVM, Peak EVM, slot 4: 6.018 13.543%
PDSCH RMS EVM, Peak EVM, slot 5: 8.768 28.480%
DM-RS RMS EVM, Peak EVM, slot 5: 6.157 13.688%
PDSCH RMS EVM, Peak EVM, slot 6: 8.544 28.595%
DM-RS RMS EVM, Peak EVM, slot 6: 6.222 13.119%
PDSCH RMS EVM, Peak EVM, slot 7: 8.842 31.193%
DM-RS RMS EVM, Peak EVM, slot 7: 6.273 12.537%
PDSCH RMS EVM, Peak EVM, slot 8: 8.695 36.104%
DM-RS RMS EVM, Peak EVM, slot 8: 6.131 12.347%
PDSCH RMS EVM, Peak EVM, slot 9: 8.665 31.638%
DM-RS RMS EVM, Peak EVM, slot 9: 6.047 13.193%
PDSCH RMS EVM, Peak EVM, slot 10: 8.597 25.824%
DM-RS RMS EVM, Peak EVM, slot 10: 5.871 12.672%
PDSCH RMS EVM, Peak EVM, slot 11: 8.676 26.232%
DM-RS RMS EVM, Peak EVM, slot 11: 5.995 12.381%
PDSCH RMS EVM, Peak EVM, slot 12: 8.618 29.406%
DM-RS RMS EVM, Peak EVM, slot 12: 6.290 15.626%
PDSCH RMS EVM, Peak EVM, slot 13: 8.531 23.032%
DM-RS RMS EVM, Peak EVM, slot 13: 5.982 11.627%
PDSCH RMS EVM, Peak EVM, slot 14: 8.535 26.429%
DM-RS RMS EVM, Peak EVM, slot 14: 6.139 12.100%
PDSCH RMS EVM, Peak EVM, slot 15: 8.785 26.037%
DM-RS RMS EVM, Peak EVM, slot 15: 6.201 13.585%
PDSCH RMS EVM, Peak EVM, slot 16: 8.701 28.963%
DM-RS RMS EVM, Peak EVM, slot 16: 6.137 12.836%
PDSCH RMS EVM, Peak EVM, slot 17: 8.665 31.418%
DM-RS RMS EVM, Peak EVM, slot 17: 6.122 12.819%
PDSCH RMS EVM, Peak EVM, slot 18: 8.682 31.576%
DM-RS RMS EVM, Peak EVM, slot 18: 6.195 12.774%
PDSCH RMS EVM, Peak EVM, slot 19: 8.756 23.086%
DM-RS RMS EVM, Peak EVM, slot 19: 6.197 15.188%
PDSCH RMS EVM, Peak EVM, slot 21: 8.740 26.457%
DM-RS RMS EVM, Peak EVM, slot 21: 6.350 13.765%
PDSCH RMS EVM, Peak EVM, slot 22: 8.831 35.989%
DM-RS RMS EVM, Peak EVM, slot 22: 6.275 12.381%
Averaged RMS EVM frame 0: 8.677%
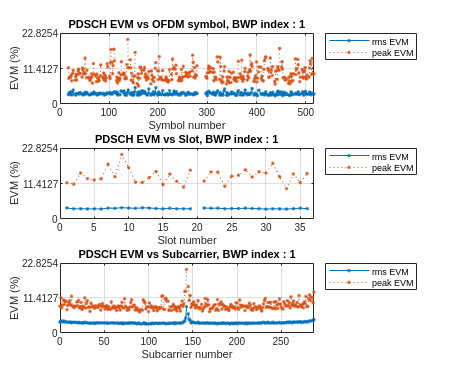
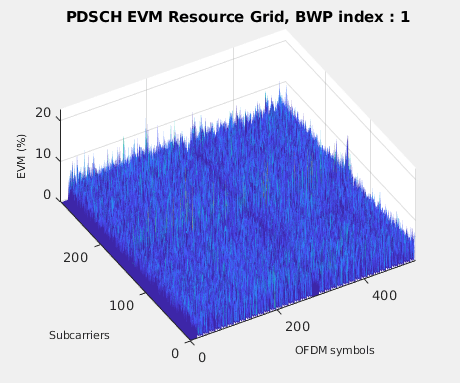
Averaged overall PDSCH RMS EVM: 8.677%
Overall PDSCH Peak EVM = 41.1036%
The output of the hNRDownlinkEVM function shows that the demodulation of the received waveform is successful.