replace
Remove current data and add new data to Smith chart
Description
Examples
Plot the reflection coefficients of a dipole antenna.
Create a strip dipole antenna on the Y-Z plane. Calculate the complex S-parameters of the dipole antenna from 60 MHz to 90 MHz, with an interval of 150 kHz.
Plot S11 on a Smith chart for a reference impedance of 50 ohm.
d = dipole;
freq = linspace(60e6,90e6,200);
s_50 = sparameters(d,freq,50);
hg = smithplot(s_50,[1,1]);
hg.LegendLabels = 'S11 at 50#ohm'; 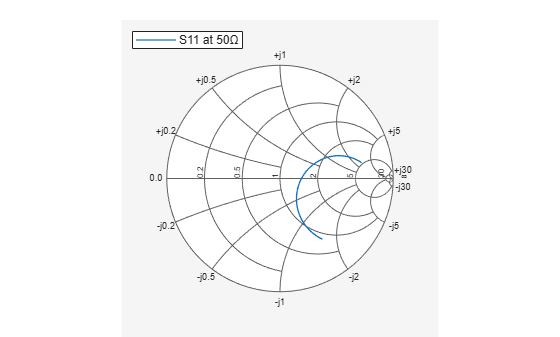
Find S11 for a new impedance of 75 ohm. Replace the old S11 by the new S11 on the existing Smith chart.
s_75 = sparameters(d,freq,75);
gamma = rfparam(s_75,1,1);
replace(hg,gamma);
hg.LegendLabels = 'S11 at 75#ohm';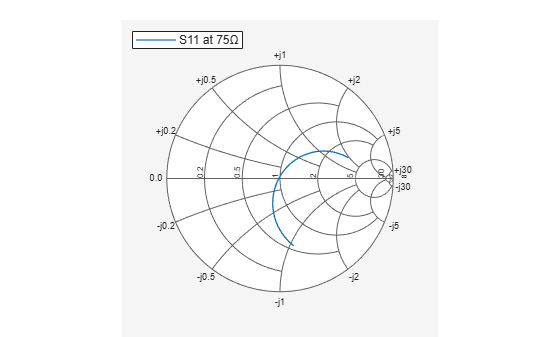
Input Arguments
Version History
Introduced in R2017b