Read, Visualize and Write MSI Planet Antenna Files
This example shows how to read an MSI Planet antenna file (.msi or .pln). You can read an MSI file using the msiread function and visualize the data using the polarpattern function. You can also write the data back into the MSI Planet format using the msiwrite function.
Read MSI Planet Antenna File
Read the .pln file.
[Horizontal,Vertical,Optional] = msiread("Test_file_demo.pln");The MSI Planet file reader returns 3 structures. Horizontal and Vertical structures contains the 7 fields: 1) PhysicalQuantity: Describes the nature of the data in the file. Typically, MSI Planet files contains antenna gain data. 2) Magnitude: Gain data 3) Units: Units of the data 4) Azimuth: Azimuthal angle(s) in degrees at which the data was measured. 5) Elevation: Elevation angle(s) in degrees at which the data was measured. 6) Frequency: Frequency of operation in Hertz. 7) Slice: Cut plane of the data measured. This plane can be 'Azimuth' or 'Elevation'.
Optional structure contains all the other fields from the file such as: name, make, frequency, h_width, v_width, front_to_back, gain, tilt, polarization, comment. There can also be other fields in the file.
The horizontal and vertical gain data in the MSI Planet file is specified as loss data and is relative to the gain specified in the file. This data is converted to gain data. After reading the file, the relativity to gain is removed in the horizontal and vertical structures.
The front_to_back ratio in the MSI Planet file is calculated either from the horizontal gain data or vertical gain data. The results can reflect one of these possibilities: 1) Ratio between the peak value and the value in the opposite hemisphere (180 degrees from the peak value angle). 2) Ratio between the peak value and the worst-case value in the 60-degree sector ((peak angle + 180) +/- 30 degrees). 2) Ratio between the peak value and the worst-case value in the 40-degree sector ((peak angle + 180) +/- 20 degrees).
Visualize Data from MSI Planet Antenna File
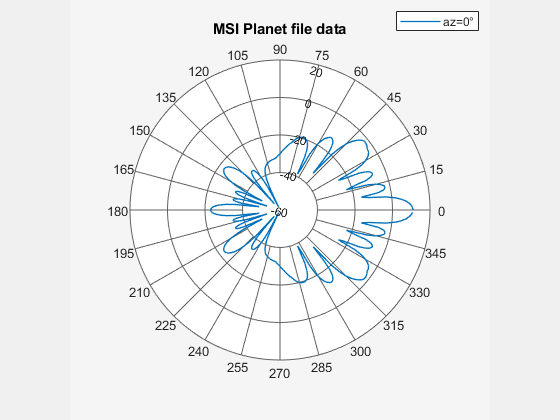
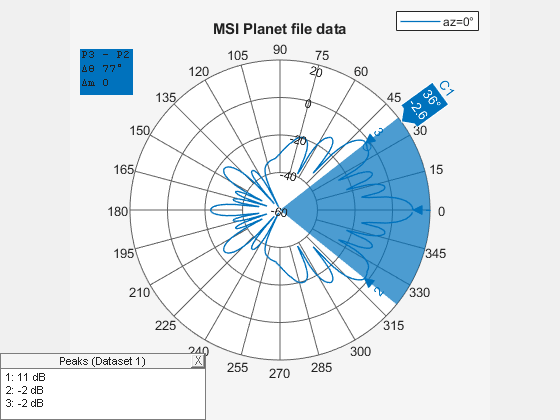
Visualize the vertical gain data in an interactive 2D polar plot. Right click in the figure window to interact with the plot.
P = polarpattern(Vertical.Elevation,Vertical.Magnitude);
P.TitleTop = "MSI Planet file data";
createLabels(P,"az=0#deg");
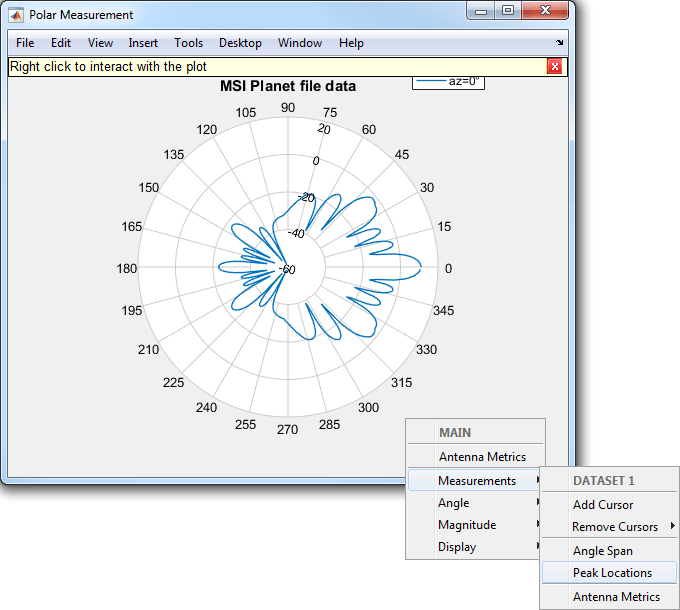
Enabling Peaks, Cursors, and Angle Span
Peaks and cursors can be enabled using the interactive plot or the command line. To turn on peaks, right click on the plot. Click on the Measurements tab and then check Peak Locations from the context menu. To control the number of peaks using the plot, right click on any of the peak triangles and use the Num Peaks from the context menu.
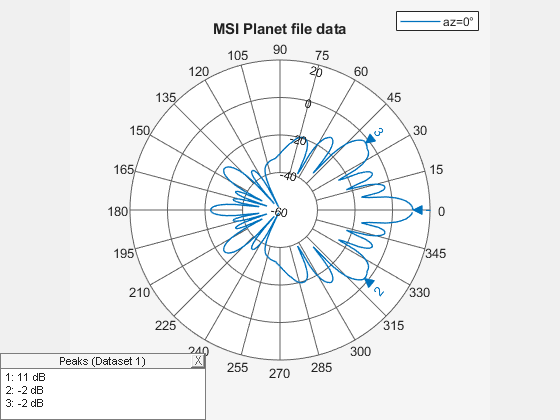
The peaks can also be turned on using the command line.
P.Peaks = 3;
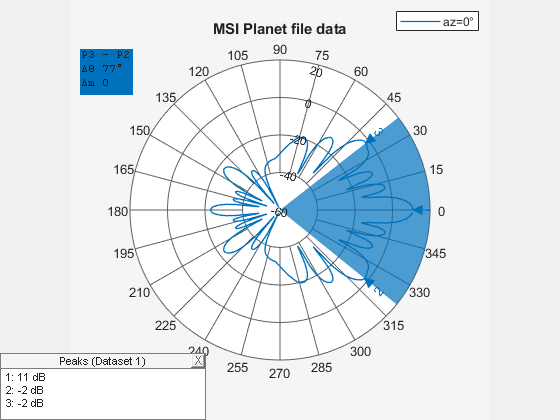
To turn on the angle span, right click on the plot. Click on Measurements tab and then check Angle Span context menu. To turn on angle span between peaks 2 and 3 the user can use the following function.
showSpan(P,'P2','P3',1);
To add a cursor, double click on the plot at the intended location. The cursor can be moved using the mouse. A cursor can be added at 36 degrees using the following function
addCursor(P,36,1);
Turning on Antenna Metrics for Lobes Visualization and Measurements
Turning on antenna metrics displays the main, back and side lobes on the plot. It also gives a text box with antenna measurements: 1) Half-power Beamwidth 2) First-Null Beamwidth 3) Front-to-Back ratio 4) Side-lobe level 5) Main lobe peak value and corresponding angle 6) Back lobe peak value and corresponding angle.
Some of these measurements like the Half-power Beamwidth and the Front-to-Back ratio are available in the MSI Planet files. These results can be compared and verified between the files and the plot.
P = polarpattern(Vertical.Elevation,Vertical.Magnitude);
P.AntennaMetrics = 1;

Write Data in MSI Planet File Format
Call the msiwrite function to take the 3 output structures from the msiread function and write the data in the MSI Planet file format.
msiwrite("Test_file_demo_write.pln",Horizontal,Vertical,Optional);The first three inputs to msiwrite function are mandatory. These are the filename, the horizontal data structure and the vertical data structure. The user can also provide an optional structure as the 4th argument. Horizontal and Vertical data structures should contain the 7 fields discussed before.
The gain data is made relative to the gain value and is converted to dB loss when it is written to the file.
msiwrite functionality can also accept an antenna or array object as an input. Other inputs are frequency, filename and two name-value pairs: 'Name' and 'Comment'. Using this functionality you can first design the antenna. You can then input the antenna object along with the desired frequency and filename into the MSI Planet file format. Create a helix antenna with default configuration. Write its pattern data to a .pln file.
h = helix;
msiwrite(h,2e9,"test_helix",Name="Test_Antenna",...
    Comment='Designed Helix Antenna in MATLAB');