ramachandran
Ramachandran plot for Protein Data Bank (PDB) data
Syntax
Description
info = ramachandran(pdbID)pdbID.
info = ramachandran(___,Name=Value)Chain to "all".
Examples
Draw the Ramachandran plot for the human serum albumin complexed with octadecanoic acid, which has a PDB database identifier of 1E7I.
ramachandran("1E7I");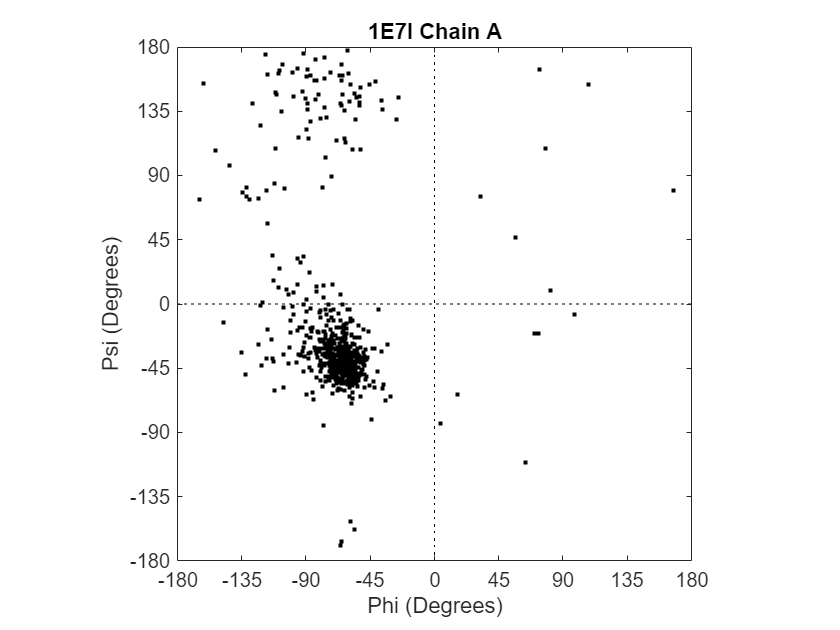
To retrieve protein structure data for the human growth hormone from the PDB database, use the getpdb function. Save the information to a file.
pbd1a22 = getpdb("1a22",ToFile="1a22.pdb");
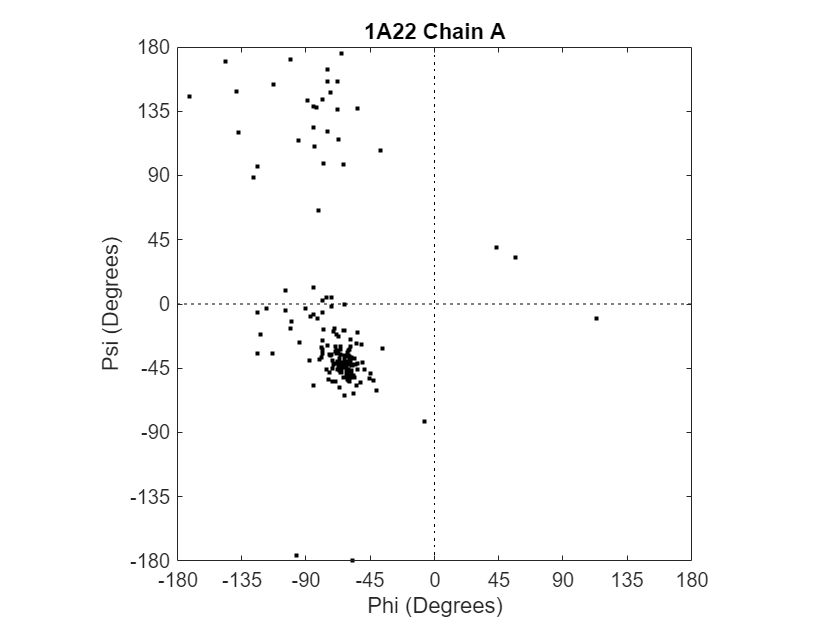
Compute the torsion angles and draw the Ramachandran plot for chain A of the human growth hormone, which is represented in the PDB file 1a22.pdb.
pbd1a22ChainA = ramachandran("1a22.pdb",Chain="A")
pbd1a22ChainA = struct with fields:
         Angles: [191×3 double]
     ResidueNum: [191×1 double]
    ResidueName: {191×1 cell}
          Chain: 'A'
        HPoints: [1×1 Line]
To retrieve protein structure data for the human growth hormone from the PDB database and store the information in a structure, use the getpdb function.
struct1a22 = getpdb("1a22");Draw a combined Ramachandran plot for all chains of the human growth hormone represented in the PDB structure struct1a22. Highlight the glycine residues with a circle. Draw the reference Ramachandran regions in the plot.
ramachandran(struct1a22,Chain="all",...
    Glycine=true,Regions=true);
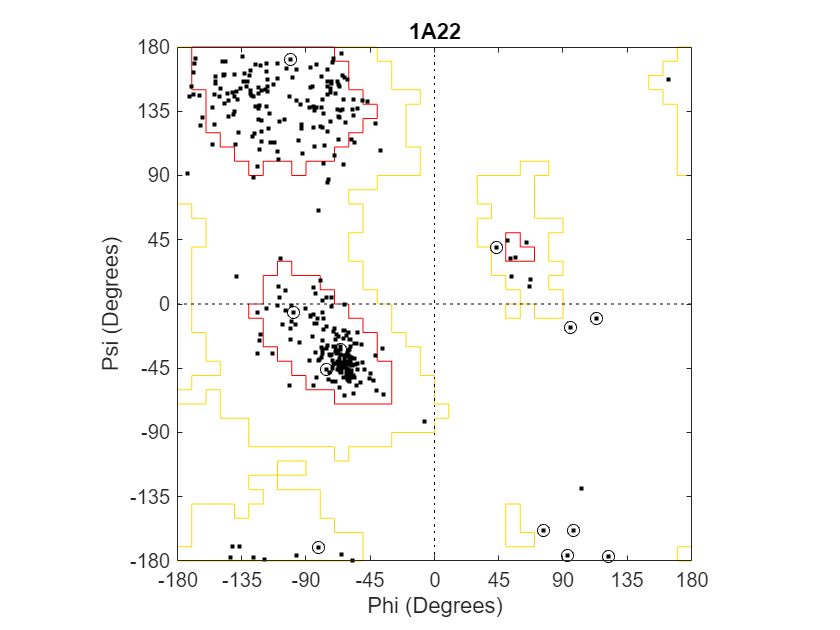
To display a data tip with information about the residue, click a data point. To display a data tip defining a region, click the region. To display multiple data tips, press and hold the Alt key.
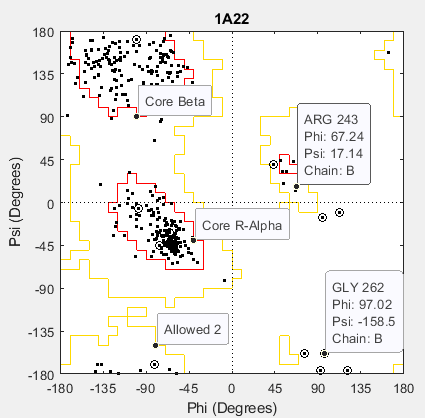
Draw a separate Ramachandran plot for each chain of the human growth hormone represented in the PDB structure struct1a22. Highlight the glycine residues with a circle. Draw the reference Ramachandran regions in the plot.
ramachandran(struct1a22,Chain="all",Plot="separate",...
    Glycine=true,Regions=true);
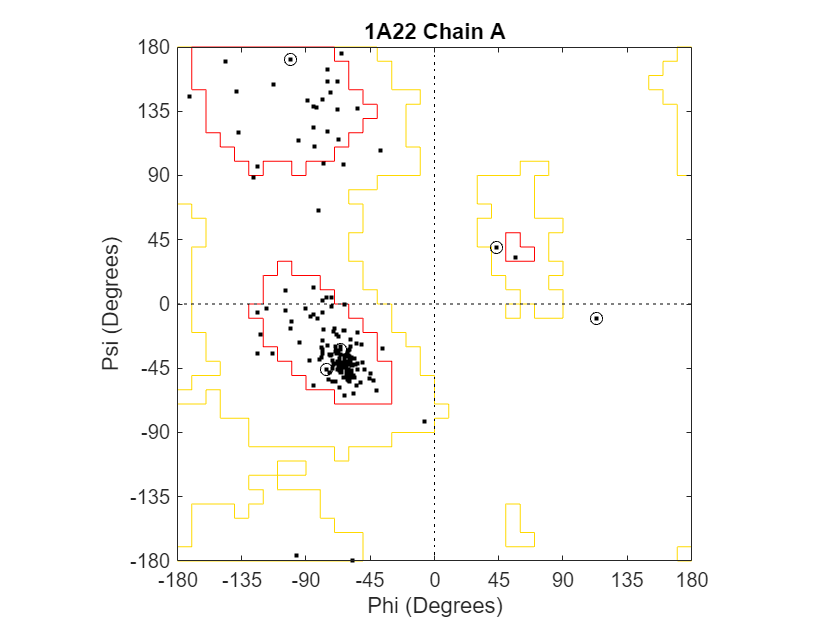
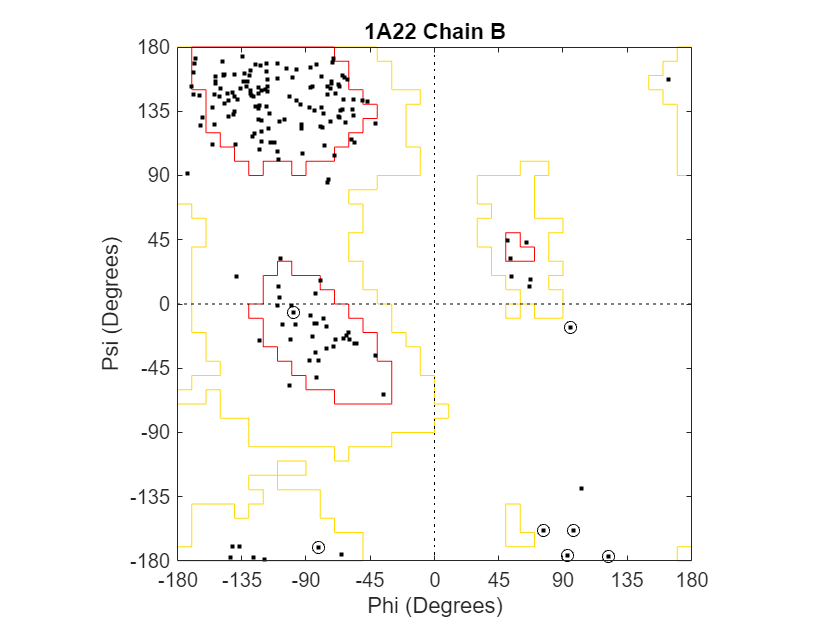
Create an array of two structures containing torsion angles for chains A and D in the Calcium/Calmodulin-dependent protein kinase, which has a PDB database identifier of 1hkx.
a = ramachandran("1hkx",Chain=["A","D"])
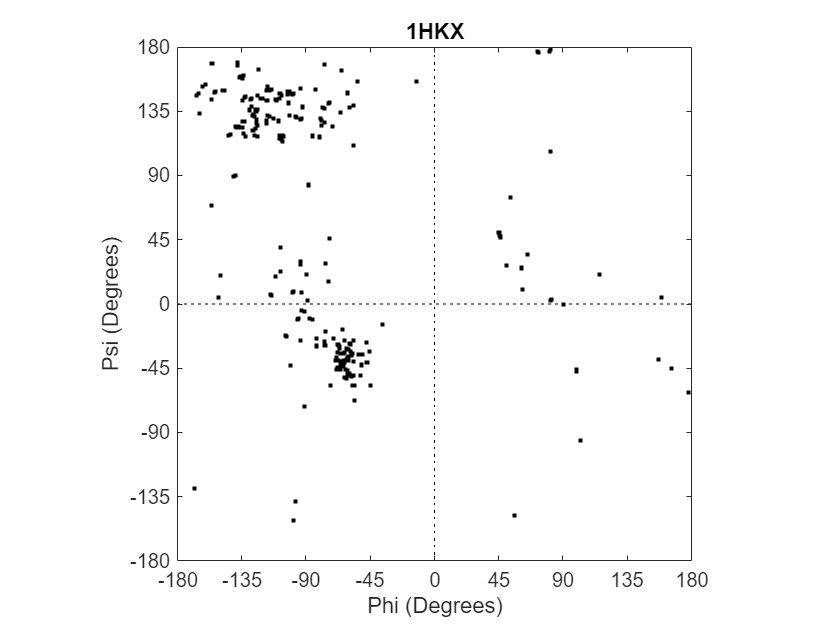
a=1×2 struct array with fields:
    Angles
    ResidueNum
    ResidueName
    Chain
    HPoints
Write a tab-delimited report file containing torsion angles phi (Φ) and psi (Ψ) for chains A and D in the Calcium/Calmodulin-dependent protein kinase.
fid = fopen("rama_1hkx_report.txt","wt");
for c = 1:numel(a)
    for i = 1:length(a(c).Angles)
        if ~all(isnan(a(c).Angles(i,:)))
            fprintf(fid,"%s\t%d\t%s\t%f\t%f\n",a(c).Chain,...
                a(c).ResidueNum(i),a(c).ResidueName{i},...
                a(c).Angles(i,1:2));
        end
    end
end
fclose(fid);
Open the file you created.
edit rama_1hkx_report.txt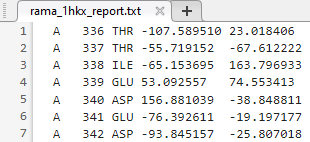
Input Arguments
Unique identifier for protein structure record in PDB database, specified as a character vector or string scalar.
Each structure in the PDB database is represented by a four-character
alphanumeric identifier. For example, the identifier for hemoglobin is
4hhb.
Filename with or without path, specified as a character vector or string scalar.
The referenced file is a PDB-formatted file. If you specify only a filename, that file must be on the MATLAB search path or in the MATLAB Current Directory.
Name-Value Arguments
Specify optional pairs of arguments as
Name1=Value1,...,NameN=ValueN, where Name is
the argument name and Value is the corresponding value.
Name-value arguments must appear after other arguments, but the order of the
pairs does not matter.
Example: ramachandran("1a22",Glycine=true,Regions=true);
Chains, specified as "all" or a character vector,
cell array of character vectors, or string array.
To compute and plot the torsion angles for all chains, use
"all".
To specify one or more case-sensitive chain IDs, use a character vector, cell array of character vectors, or string array.
How to plot chains, specified as "combined",
"separate", or "none".
"combined"— Plot torsion angles for all specified chains in one combined plot."separate"— Plot torsion angles for all specified chains in separate plots."none"— Plot nothing.
Structure model to consider, specified as an integer.
Highlighting of glycine residues with a circle in the plot, specified
as true or false.
Drawing of Ramachandran reference regions in the plot, specified as
true or false.
The default regions are core right-handed alpha, core beta, core left-handed alpha, and allowed. The core regions correspond to data points of preferred values of psi/phi angle pairs. The allowed regions correspond to possible, but disfavored values of psi/phi angle pairs, based on simple energy considerations. The boundaries of these default regions are based on the calculations by Morris et al., 1992.
The default colormap uses red for core regions and yellow for allowed regions.
Custom reference region information in a Ramachandran plot, specified as a MATLAB structure or array of structures. Each structure must contain these fields:
Name— Name of the region, specified as a character vector or string scalar.Color— Color of the region in the plot, specified as a character vector, string scalar, or three-element numeric vector of RGB values.Patch— Boundary of the region, specified as a 2-by-N matrix of values. The first row of the matrix contains the torsion angle phi (Φ) values. The second row of the matrix contains the torsion angle psi (Ψ) values. N is the number of data points needed to define the region. When you plot the psi/phi angle pairs, the data points specify the boundary of the region.
To specify multiple regions, use an array of structures. When a larger region contains or covers a smaller region, list the structure for the smaller region first in the array so that the smaller region is plotted last and is visible in the plot.
Output Arguments
Information about torsion angles, residues, chains, and data points, returned as a MATLAB structure or array of MATLAB structures. Each structure contains the fields described in this table.
| Field | Description |
|---|---|
Angles | Three-column matrix containing the torsion angles
phi (Φ), psi (Ψ), and omega (ω) for each residue in the
sequence, ordered by residue sequence number. The number
of rows in the matrix is equal to the number of rows in
the The |
ResidueNum | Column vector containing the residue sequence numbers from the PDB file. The
The The angles listed in the
|
ResidueName | Column vector containing the residue names for the protein. |
Chain | Character vector or string specifying the chains in the protein. |
HPoints | Handle to the data points in the plot. |
More About
A Ramachandran plot is a plot of the torsion angle phi, Φ, (torsion angle between
the C-N-CA-C atoms) versus the torsion angle psi, Ψ, (torsion
angle between the N-CA-C-N atoms) for each residue of a protein
sequence.
References
[1] Morris, A.L., MacArthur, M.W., Hutchinson, E.G., and Thornton, J.M. (1992). Stereochemical Quality of Protein Structure Coordinates. PROTEINS: Structure, Function, and Genetics 12, 345–364.
Version History
Introduced before R2006a
See Also
MATLAB Command
You clicked a link that corresponds to this MATLAB command:
Run the command by entering it in the MATLAB Command Window. Web browsers do not support MATLAB commands.
Seleziona un sito web
Seleziona un sito web per visualizzare contenuto tradotto dove disponibile e vedere eventi e offerte locali. In base alla tua area geografica, ti consigliamo di selezionare: .
Puoi anche selezionare un sito web dal seguente elenco:
Come ottenere le migliori prestazioni del sito
Per ottenere le migliori prestazioni del sito, seleziona il sito cinese (in cinese o in inglese). I siti MathWorks per gli altri paesi non sono ottimizzati per essere visitati dalla tua area geografica.
Americhe
- América Latina (Español)
- Canada (English)
- United States (English)
Europa
- Belgium (English)
- Denmark (English)
- Deutschland (Deutsch)
- España (Español)
- Finland (English)
- France (Français)
- Ireland (English)
- Italia (Italiano)
- Luxembourg (English)
- Netherlands (English)
- Norway (English)
- Österreich (Deutsch)
- Portugal (English)
- Sweden (English)
- Switzerland
- United Kingdom (English)