qammod
Quadrature amplitude modulation (QAM)
Description
Y = qammod(___,Name=Value)InputType=bit sets the type of input signal to
bits.
Examples
Modulate data using QAM and display the result in a scatter plot.
Set the modulation order to 16 and create a data vector containing each of the possible symbols.
M = 16;
x = (0:M-1)';
Modulate the data using the qammod function.
y = qammod(x,M);
Display the modulated signal constellation using the scatterplot function.
scatterplot(y)

Set the modulation order to 256, and display the scatter plot of the modulated signal.
M = 256;
x = (0:M-1)';
y = qammod(x,M);
scatterplot(y)

Modulate random data symbols using QAM. Normalize the modulator output so that it has an average signal power of 1 W.
Set the modulation order and generate random data.
M = 64;
x = randi([0 M-1],1000,1);
Modulate the data. Use the 'UnitAveragePower' name-value argument to set the output signal to have an average power of 1 W.
y = qammod(x,M,UnitAveragePower=true);
Confirm that the signal has unit average power.
avgPower = mean(abs(y).^2)
avgPower =
1.0070
Plot the resulting constellation.
scatterplot(y)
title('64-QAM, Average Power = 1 W')
Plot QAM constellations for Gray, binary, and custom symbol mappings.
Set the modulation order, and create a data sequence that includes a complete set of symbols for the modulation scheme.
M = 16;
d = 0:M-1;
Modulate the data, and plot its constellation. The default symbol mapping uses Gray-coded ordering. The ordering of the points is not sequential.
y = qammod(d,M,PlotConstellation=true);

Repeat the modulation process with binary symbol mapping. The symbol mapping follows a binary-coded order and is sequential.
z = qammod(d,M,'bin',PlotConstellation=true);
Create a custom symbol mapping.
smap = randperm(M)-1;
Modulate and plot the constellation.
w = qammod(d,M,smap,PlotConstellation=true);

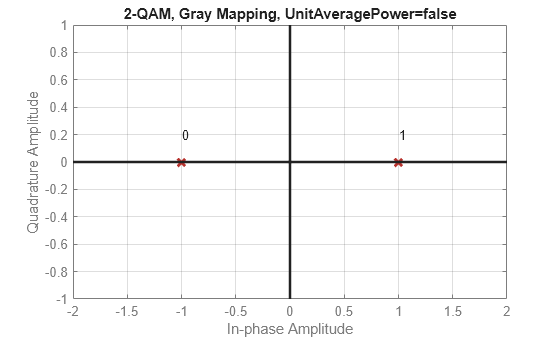
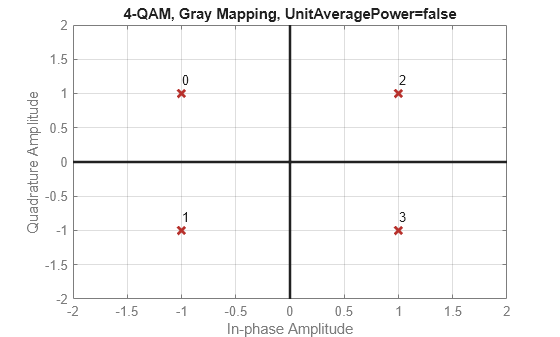
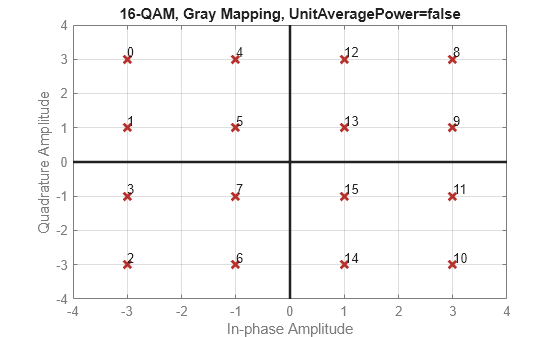
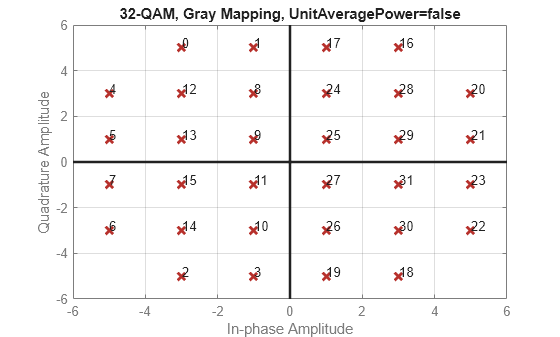
Plot various M-QAM constellations to demonstrate the shape depends on the modulation order.
Define a vector of vlaues for modulation order, , from the number of bits/symbol, .
k = 1:7;  % Number of bits per symbol
M = 2.^k; % Modulation order
Use a for loop to create a data sequence that includes a complete set of symbols for the modulation scheme, modulate the data, and plot the constellation for each modulation order in the range of values in vector k. Note the constellation shape for depends on the number of bits per symbol, k.
For even values of
k, the constellation is a square.For odd values of , the constellation is a cross.
For and , the constellation is a rectangle.
for ii = 1:length(M)
    disp(['k = ',num2str(k(ii))])
    d = 0:M(ii)-1;
    y = qammod(d,M(ii),PlotConstellation=true);

end
k = 1
k = 2
k = 3

k = 4
k = 5
k = 6
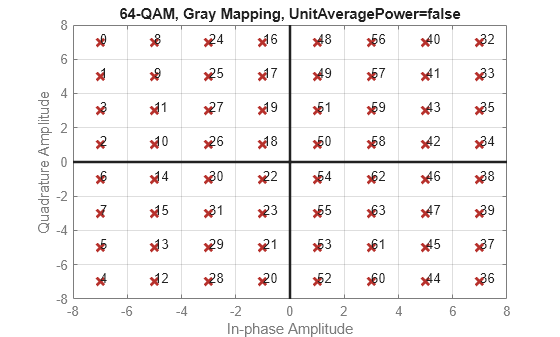
k = 7
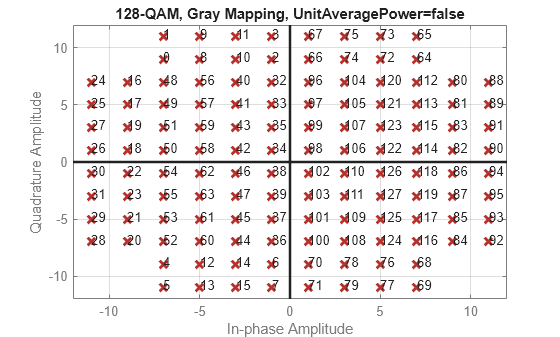
Modulate a sequence of bits using 64-QAM. Pass the signal through a noisy channel. Display the resultant constellation diagram.
Set the modulation order, and determine the number of bits per symbol.
M = 64;
k = log2(M);
Create a binary data sequence. When using binary inputs, the number of rows in the input must be an integer multiple of the number of bits per symbol.
data = randi([0 1],1000*k,1);
Modulate the signal using bit inputs, and set it to have unit average power.
txSig = qammod(data,M, ...
    InputType='bit', ...
    UnitAveragePower=true);
Pass the signal through a noisy channel.
rxSig = awgn(txSig,25);
Plot the constellation diagram.
cd = comm.ConstellationDiagram(ShowReferenceConstellation=false);
cd(rxSig)

Demodulate a fixed-point QAM signal and verify that the data is recovered correctly.
Set the modulation order as 64, and determine the number of bits per symbol.
M = 64;
bitsPerSym = log2(M);
Generate random bits. When operating in bit mode, the length of the input data must be an integer multiple of the number of bits per symbol.
x = randi([0 1],10*bitsPerSym,1);
Modulate the input data using a binary symbol mapping. Set the modulator to output fixed-point data. The numeric data type is signed with a 16-bit word length and a 10-bit fraction length.
y = qammod(x,M,'bin', ...
    InputType='bit', ...
    OutputDataType=numerictype(1,16,10));
Demodulate the 64-QAM signal. Verify that the demodulated data matches the input data.
z = qamdemod(y,M,'bin',OutputType='bit');
s = isequal(x,double(z))
s = logical
   1
Apply average power normalization for hard decision output when using qammod and qamdemod functions by using the helperAvgPow2MinD utility function. Scale the constellation to the normalized average power, and then plot the reference and scaled constellations.
Compute the minimum distance for symbols based on specified average power and modulation order.
M = 64;
avgPwr = 2;
minD = helperAvgPow2MinD(avgPwr,M);
Modulate a signal composed of random integers in the range [0, M - 1], scale the modulated symbols.
x = randi([0,M-1],1000,1);
y = qammod(x,M);
yTx = (minD/2) .* y;
Verify signal average power approximately equals the specified average power, avgPow.
sigPwr = mean(abs(yTx).^2)
sigPwr =
2.0141
avgPwr
avgPwr =
2
Assign the transmitted signal to the receive signal without applying any RF or channel impairments. With no impairments to distort the received signal, the demodulated matches the original signal. Demodulate symbols using hard decisions, and confirm correct signal demodulation.
yRx = yTx;
z = qamdemod(yRx*2/minD,M);
checkDemodIsEqual = isequal(x,z)
checkDemodIsEqual = logical
   1
refC = qammod([0:M-1]',M);
Show constellation
maxAx = ceil(max(abs(refC)));
cd = comm.ConstellationDiagram(2, ...
    'ShowReferenceConstellation',0, ...
    'ShowLegend',true, ...
    'XLimits',[-(maxAx) maxAx],'YLimits',[-(maxAx) maxAx], ...
    'ChannelNames', ...
    {'y','yTx'});
cd(y,yTx)

Apply peak power normalization for hard decision output when using qammod and qamdemod functions by using the helperPeakPow2MinD utility function. Scale the constellation to the normalized peak power, and then plot the reference and scaled constellations.
Compute the minimum distance for symbols based on specified peak power and modulation order.
M = 16;
pkPwr = 30;
minD = helperPeakPow2MinD(pkPwr,M);
Modulate a signal composed of random integers in the range [0, M - 1], scale the modulated symbols.
x = randi([0,M-1],1000,1);
y = qammod(x,M);
yTx = (minD/2) .* y;
Verify signal peak power approximately equals the specified peak power, pkPow.
sigPwr = max(abs(yTx).^2)
sigPwr =
30
pkPwr
pkPwr =
30
Assign the transmitted signal to the receive signal without applying any RF or channel impairments. With no impairments to distort the received signal, the demodulated matches the original signal. Demodulate symbols using hard decisions, and confirm correct signal demodulation.
yRx = yTx;
z = qamdemod(yRx*2/minD,M);
checkDemodIsEqual = isequal(x,z)
checkDemodIsEqual = logical
   1
refC = qammod([0:M-1]',M);
Show constellation
maxAx = ceil(max(abs(refC)));
cd = comm.ConstellationDiagram(2, ...
    'ShowReferenceConstellation',0, ...
    'ShowLegend',true, ...
    'XLimits',[-(maxAx) maxAx],'YLimits',[-(maxAx) maxAx], ...
    'ChannelNames', ...
    {'y','yTx'});
cd(y,yTx)

Input Arguments
Input signal, specified as a scalar, vector, matrix, or array. The
elements of this input signal must be binary values or integers in the range [0, (M – 1)], where M is the modulation
order.
Note
To process input signal as binary elements, specify
InputType='bit'. For binary inputs, the number of
rows must be an integer multiple of log2(M). Groups of log2(M) bits are mapped onto a symbol, with the first bit
representing the MSB and the last bit representing the LSB.
Data Types: double | single | fi(S,WL,0) | int8 | int16 | uint8 | uint16
Modulation order, specified as an positive integer power of two. The modulation order specifies the number of points in the signal constellation.
Data Types: double | single | int8 | int16 | int32 | int64 | uint8 | uint16 | uint32 | uint64
Symbol order, specified as 'gray',
'bin', or a vector.
'gray'— Use Gray-coded ordering. For more information, see Gray Code.'bin'— Use binary-coded ordering.Vector — Use custom symbol ordering
Vectors must use unique elements in the range [0, (M – 1)]. The first element corresponds to the upper-left point of
the constellation, with subsequent elements running down column-wise from
left to right.
Example: [0 3 1 2]
Data Types: string | char | double | single | int8 | int16 | int32 | int64 | uint8 | uint16 | uint32 | uint64
Name-Value Arguments
Specify optional pairs of arguments as
Name1=Value1,...,NameN=ValueN, where Name is
the argument name and Value is the corresponding value.
Name-value arguments must appear after other arguments, but the order of the
pairs does not matter.
Before R2021a, use commas to separate each name and value, and enclose
Name in quotes.
Example: y =
qammod(x,M,symOrder,'InputType','bit')
Input type, specified as 'integer' or
'bit'.
If you specify
'integer', the input signal must consist of integers in the range [0, (M– 1)].If you specify
'bit', the input signal must contain binary values, and the number of rows must be an integer multiple of log2(M).
Unit average power flag, specified as a numeric or logical
0 (false) or
1 (true).
When this flag is
1(true), the function scales the constellation to the average power of one watt referenced to 1 ohm.When this flag is
0(false), the function scales the constellation so that the QAM constellation points are separated by a minimum distance of two.
Output data type, specified as 'double',
'single', or a numerictype
object. For more information on constructing these objects, see
numerictype (Fixed-Point Designer). This
argument determines the data type of the output modulated symbols and
the data type used for intermediate computations. Output the fixed-point
type as a signed, unscaled numerictype object in
MATLAB® simulation, and as a signed, scaled
numerictype object during C code or MEX generation.
If you do not specify this argument and the input is data type
doubleor a built-in integer, the output data type isdouble.If the input is data type
single, the output data type issingle.If the input is fixed-point, this argument must be specified.
Option to plot constellation, specified as a numeric or logical
0 (false) or
1 (true). To plot the QAM
constellation, specify PlotConstellation=true.
Output Arguments
Modulated signal, returned as a complex scalar, vector, matrix, or array of numeric values.
For more information on the output data type, see OutputDataType.
Data Types: double | single | fi | int8 | int16 | uint8 | uint16
More About
A Gray code, also known as a reflected binary code, is a system where the bit patterns in adjacent constellation points differ by only one bit.
Extended Capabilities
C/C++ Code Generation
Generate C and C++ code using MATLAB® Coder™.
This function supports GPU array inputs. For more information, see Run MATLAB Functions on a GPU (Parallel Computing Toolbox).
Usage notes and limitations:
Fixed-point output data types are not supported.
Version History
Introduced before R2006aThe qammod function enhances output data type offering by
using the OutputDataType
argument. Previously, the output data type was inherited from input data type or set
to a fixed-point setting. This addition allows you to also specify the output data
type as single or double.
The qammod function adds support for gpuArray (Parallel Computing Toolbox) object processing to run
code on a graphics processing unit (GPU).
Starting in R2018b, you can no longer offset the initial phase for the QAM
constellation using the qammod function.
To adjust the initial phase of the QAM-modulated data, instead use genqammod to offset the initial
phase of the data being modulated, or you can multiply the
qammod output by the desired initial
phase:
y = qammod(x,M) .* exp(1i*initPhase)
MATLAB Command
You clicked a link that corresponds to this MATLAB command:
Run the command by entering it in the MATLAB Command Window. Web browsers do not support MATLAB commands.
Seleziona un sito web
Seleziona un sito web per visualizzare contenuto tradotto dove disponibile e vedere eventi e offerte locali. In base alla tua area geografica, ti consigliamo di selezionare: .
Puoi anche selezionare un sito web dal seguente elenco:
Come ottenere le migliori prestazioni del sito
Per ottenere le migliori prestazioni del sito, seleziona il sito cinese (in cinese o in inglese). I siti MathWorks per gli altri paesi non sono ottimizzati per essere visitati dalla tua area geografica.
Americhe
- América Latina (Español)
- Canada (English)
- United States (English)
Europa
- Belgium (English)
- Denmark (English)
- Deutschland (Deutsch)
- España (Español)
- Finland (English)
- France (Français)
- Ireland (English)
- Italia (Italiano)
- Luxembourg (English)
- Netherlands (English)
- Norway (English)
- Österreich (Deutsch)
- Portugal (English)
- Sweden (English)
- Switzerland
- United Kingdom (English)