Control System with Multichannel Analysis Points
This example shows how to insert multichannel analysis points in a generalized state-space model of a MIMO control system.
Consider the following two-input, two-output control system.
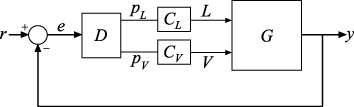
The plant G has two inputs and two outputs. Therefore, the line marked y in the block diagram represents two signals, y(1) and y(2). Similarly, r and e each represent two signals.
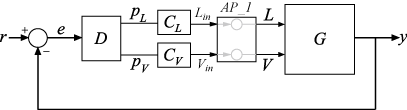
Suppose you want to create tuning requirements or extract responses that require injecting or measuring signals at the locations L and V. To do so, create an AnalysisPoint block and include it in the closed-loop model of the control system as shown in the following illustration.
To create a model of this system, first create the numeric LTI models and control design blocks that represent the plant and controller elements. D is a tunable gain block, and C_L and C_V are tunable PI controllers. Suppose the plant model is the following:
s = tf('s');
G = [87.8 -86.4 ; 108.2 -109.6]/(75*s+1);

D = tunableGain('Decoupler',eye(2));
C_L = tunablePID('C_L','pi');
C_V = tunablePID('C_V','pi');
Create an AnalysisPoint block that bundles together the L and V channels.
AP_1 = AnalysisPoint('AP_1',2)Multi-channel analysis point at locations: AP_1(1) AP_1(2) Block Properties Type "ss(AP_1)" to see the current value.
For convenience, rename the channels to match the corresponding signals.
AP_1.Location = {'L';'V'}Multi-channel analysis point at locations: L V Block Properties Type "ss(AP_1)" to see the current value.
The following diagram illustrates the input names, output names, and channel names (locations) in the block AP_1.
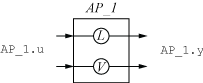
The input and output names of the AnalysisPoint block are distinct from the channel names. Use the channel names to refer to the analysis-point locations when extracting responses or defining design goals for tuning. You can use the input and output names AP_1.u and AP_1.y, for example, when interconnecting blocks using the connect command.
You can now build the closed-loop model of the control system. First, join all the plant and controller blocks along with the first AnalysisPoint block.
GC = G*AP_1*append(C_L,C_V)*D;
Then, close the feedback loop. Recall that GC has two inputs and outputs.
CL = feedback(GC,eye(2));
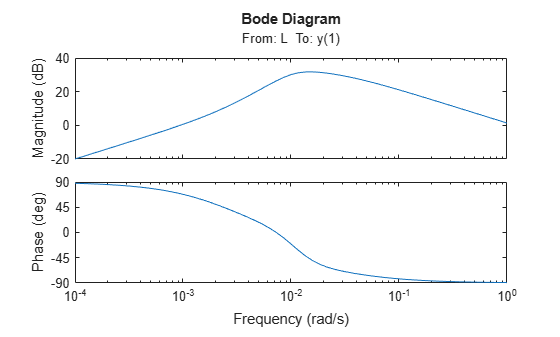
You can now use the analysis points for analysis or tuning. For example, extract the SISO closed-loop transfer function from 'L' to the first output. Assign a name to the output so you can reference it in analysis functions. The software automatically expands the assigned name 'y' to the vector-valued output signals {y(1),y(2)}.
CL.OutputName = 'y';
TLy1 = getIOTransfer(CL,'L','y(1)');
bodeplot(TLy1);