Main Content

meanrot

Quaternion mean rotation

Since R2020a

Description

quatAverage = meanrot(quat) returns the average rotation of the elements of quat along the first array dimension whose size not does equal 1.

  • If quat is a vector, meanrot(quat) returns the average rotation of the elements.

  • If quat is a matrix, meanrot(quat) returns a row vector containing the average rotation of each column.

  • If quat is a multidimensional array, then mearot(quat) operates along the first array dimension whose size does not equal 1, treating the elements as vectors. This dimension becomes 1 while the sizes of all other dimensions remain the same.

The meanrot function normalizes the input quaternions, quat, before calculating the mean.

example

quatAverage = meanrot(quat,dim) return the average rotation along dimension dim. For example, if quat is a matrix, then meanrot(quat,2) is a column vector containing the mean of each row.

quatAverage = meanrot(___,nanflag) specifies whether to include or omit NaN values from the calculation for any of the previous syntaxes. meanrot(quat,"includenan") includes all NaN values in the calculation while mean(quat,"omitnan") ignores them.

Examples

collapse all

Create a matrix of quaternions corresponding to three sets of Euler angles.

eulerAngles = [40 20 10; ...
               50 10 5; ...
               45 70 1];

quat = quaternion(eulerAngles,"eulerd","ZYX","frame");

Determine the average rotation represented by the quaternions. Convert the average rotation to Euler angles in degrees for readability.

quatAverage = meanrot(quat)
quatAverage = quaternion
      0.88863 - 0.062598i +  0.27822j +  0.35918k

eulerAverage = eulerd(quatAverage,"ZYX","frame")
eulerAverage = 1×3

   45.7876   32.6452    6.0407

Use meanrot over a sequence of quaternions to average out additive noise.

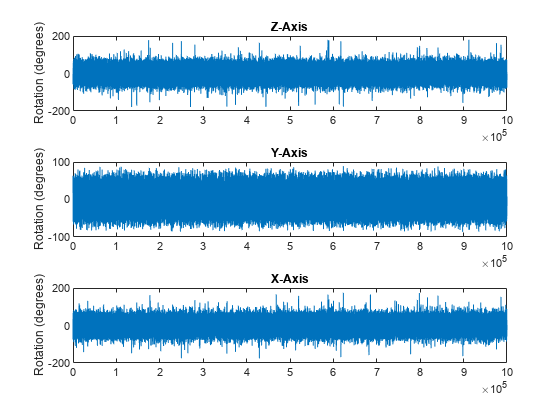
Create a vector of 1e6 quaternions whose distance, as defined by the dist function, from quaternion(1,0,0,0) is normally distributed. Plot the Euler angles corresponding to the noisy quaternion vector.

nrows = 1e6;
ax = 2*rand(nrows,3) - 1;   
ax = ax./sqrt(sum(ax.^2,2));
ang = 0.5*randn(size(ax,1),1);
q = quaternion(ax.*ang ,"rotvec");

noisyEulerAngles = eulerd(q,"ZYX","frame");

figure(1)

subplot(3,1,1)
plot(noisyEulerAngles(:,1))
title("Z-Axis")
ylabel("Rotation (degrees)")
hold on

subplot(3,1,2)
plot(noisyEulerAngles(:,2))
title("Y-Axis")
ylabel("Rotation (degrees)")
hold on

subplot(3,1,3)
plot(noisyEulerAngles(:,3))
title("X-Axis")
ylabel("Rotation (degrees)")
hold on

Figure contains 3 axes objects. Axes object 1 with title Z-Axis, ylabel Rotation (degrees) contains an object of type line. Axes object 2 with title Y-Axis, ylabel Rotation (degrees) contains an object of type line. Axes object 3 with title X-Axis, ylabel Rotation (degrees) contains an object of type line.

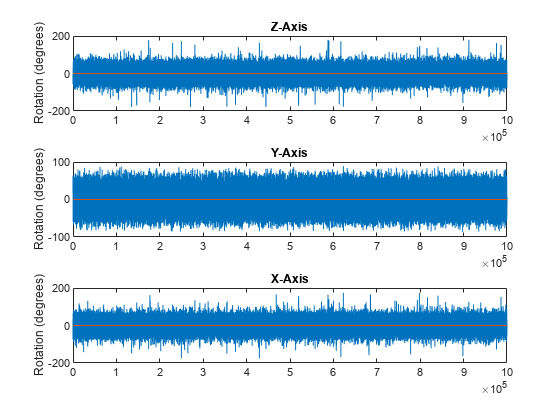
Use meanrot to determine the average quaternion given the vector of quaternions. Convert to Euler angles and plot the results.

qAverage = meanrot(q);

qAverageInEulerAngles = eulerd(qAverage,"ZYX","frame");

figure(1)

subplot(3,1,1)
plot(ones(nrows,1)*qAverageInEulerAngles(:,1))
title("Z-Axis")

subplot(3,1,2)
plot(ones(nrows,1)*qAverageInEulerAngles(:,2))
title("Y-Axis")

subplot(3,1,3)
plot(ones(nrows,1)*qAverageInEulerAngles(:,3))
title("X-Axis")

Figure contains 3 axes objects. Axes object 1 with title Z-Axis, ylabel Rotation (degrees) contains 2 objects of type line. Axes object 2 with title Y-Axis, ylabel Rotation (degrees) contains 2 objects of type line. Axes object 3 with title X-Axis, ylabel Rotation (degrees) contains 2 objects of type line.

The meanrot Algorithm

The meanrot function outputs a quaternion that minimizes the squared Frobenius norm of the difference between rotation matrices. Consider two quaternions:

  • q0 represents no rotation.

  • q90 represents a 90 degree rotation about the x-axis.

q0 = quaternion([0 0 0],"eulerd","ZYX","frame");
q90 = quaternion([0 0 90],"eulerd","ZYX","frame");

Create a quaternion sweep, qSweep, that represents rotations from 0 to 180 degrees about the x-axis.

eulerSweep = (0:1:180)';
qSweep = quaternion([zeros(numel(eulerSweep),2),eulerSweep], ...
    "eulerd","ZYX","frame");

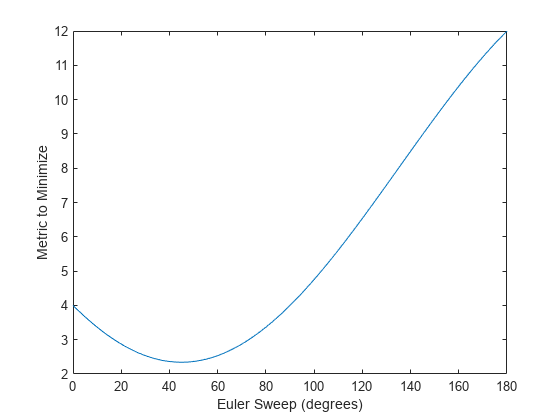
Convert q0, q90, and qSweep to rotation matrices. In a loop, calculate the metric to minimize for each member of the quaternion sweep. Plot the results and return the value of the Euler sweep that corresponds to the minimum of the metric.

r0     = rotmat(q0,"frame");
r90    = rotmat(q90,"frame");
rSweep = rotmat(qSweep,"frame");

metricToMinimize = zeros(size(rSweep,3),1);
for i = 1:numel(qSweep)
    metricToMinimize(i) = norm((rSweep(:,:,i) - r0),"fro").^2 + ...
                          norm((rSweep(:,:,i) - r90),"fro").^2;
end

plot(eulerSweep,metricToMinimize)
xlabel("Euler Sweep (degrees)")
ylabel("Metric to Minimize")

Figure contains an axes object. The axes object with xlabel Euler Sweep (degrees), ylabel Metric to Minimize contains an object of type line.

[~,eulerIndex] = min(metricToMinimize);
eulerSweep(eulerIndex)
ans = 
45

The minimum of the metric corresponds to the Euler angle sweep at 45 degrees. That is, meanrot defines the average between quaterion([0 0 0],"ZYX","frame") and quaternion([0 0 90],"ZYX","frame") as quaternion([0 0 45],"ZYX","frame"). Call meanrot with q0 and q90 to verify the same result.

eulerd(meanrot([q0,q90]),"ZYX","frame")
ans = 1×3

         0         0   45.0000

Limitations

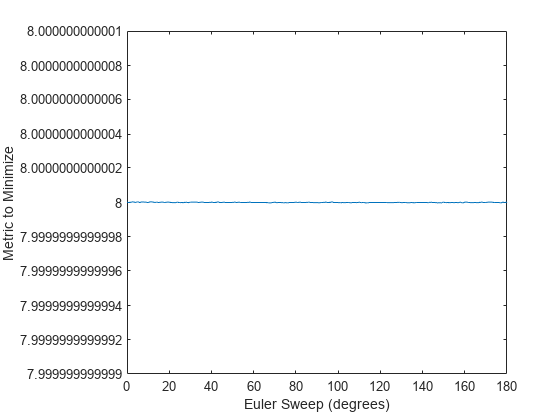
The metric that meanrot uses to determine the mean rotation is not unique for quaternions significantly far apart. Repeat the experiment above for quaternions that are separated by 180 degrees.

q180 = quaternion([0 0 180],"eulerd","ZYX","frame");
r180 = rotmat(q180,"frame");

for i = 1:numel(qSweep)
    metricToMinimize(i) = norm((rSweep(:,:,i) - r0),"fro").^2 + ...
                          norm((rSweep(:,:,i) - r180),"fro").^2;
end

plot(eulerSweep,metricToMinimize)
xlabel("Euler Sweep (degrees)")
ylabel("Metric to Minimize")

Figure contains an axes object. The axes object with xlabel Euler Sweep (degrees), ylabel Metric to Minimize contains an object of type line.

[~,eulerIndex] = min(metricToMinimize);
eulerSweep(eulerIndex)
ans = 
49

Quaternion means are usually calculated for rotations that are close to each other, which makes the edge case shown in this example unlikely in real-world applications. To average two quaternions that are significantly far apart, use the slerp function. Repeat the experiment using slerp and verify that the quaternion mean returned is more intuitive for large distances.

qMean = slerp(q0,q180,0.5);
q0_q180 = eulerd(qMean,"ZYX","frame")
q0_q180 = 1×3

         0         0   90.0000

Input Arguments

collapse all

Quaternion for which to calculate the mean, specified as a quaternion object or an array of quaternion objects of any dimensionality.

Dimension to operate along, specified as a positive integer scalar. If no value is specified, then the default is the first array dimension whose size does not equal 1.

Dimension dim indicates the dimension whose length reduces to 1. The size(quatAverage,dim) is 1, while the sizes of all other dimensions remain the same.

Data Types: double | single

NaN condition, specified as one of these values:

  • "includenan" –– Include NaN values when computing the mean rotation, resulting in NaN.

  • "omitnan" –– Ignore all NaN values in the input.

Data Types: char | string

Output Arguments

collapse all

Quaternion average rotation, returned as a quaternion object or an array of quaternion objects.

Algorithms

meanrot determines a quaternion mean, q¯, according to [1]. q¯ is the quaternion that minimizes the squared Frobenius norm of the difference between rotation matrices:

q¯=argminqS3i=1nA(q)A(qi)F2

References

[1] Markley, F. Landis, Yang Chen, John Lucas Crassidis, and Yaakov Oshman. "Average Quaternions." Journal of Guidance, Control, and Dynamics. Vol. 30, Issue 4, 2007, pp. 1193-1197.

Extended Capabilities

C/C++ Code Generation
Generate C and C++ code using MATLAB® Coder™.

Version History

Introduced in R2020a