PhaseNoiseConfiguration
Description
Use the PhaseNoiseConfiguration object to measure and display
phase noise by using the spectrum analyzer.
Note
To create and use the PhaseNoiseConfiguration object, you must have
a valid Mixed-Signal Blockset™ license.
You can measure the phase noise and plot it against the specified target phase noise
profile from the spectrum analyzer toolstrip or from the command line. The spectrumAnalyzer
object and the SpectrumAnalyzerBlockConfiguration object
support the PhaseNoiseConfiguration object in the command line.
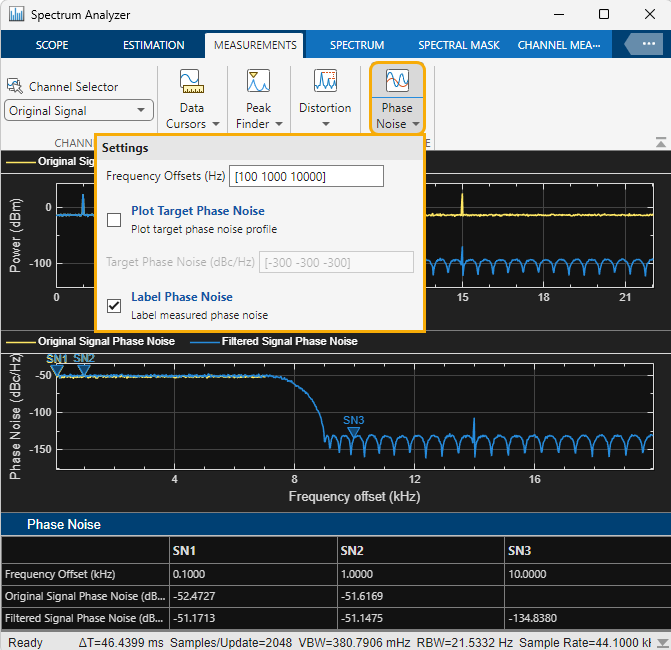
To modify the phase noise measurement settings in the spectrum analyzer toolstrip, click the Measurements tab and edit the settings in the Phase Noise section.
Creation
Description
phasemeas = PhaseNoiseConfiguration() creates a phase noise
measurements configuration object phasemeas. Use this
configuration object with the spectrumAnalyzer and SpectrumAnalyzerBlockConfiguration objects.
Properties
Examples
Measure the phase noise of a noisy sinusoidal signal using the PhaseNoise property of the spectrumAnalyzer object.
Initialization
Construct a spectrumAnalyzer object. Set the spectrum estimation method to "welch", averaging method to "exponential", forgetting factor to 0.9, RBW to 25000, and frequency offset to 2700 MHz.
Fs = 40e6;
rbw = 25e3;
Offset = 2.7e9;
sa = spectrumAnalyzer(SampleRate=Fs,...
    RBWSource="property",...
    RBW=rbw,...
    Method="welch",...
    AveragingMethod="exponential",...
    ForgettingFactor=0.9,...
    FrequencyOffset=Offset,...
    Window="hann",...
    ShowLegend=true,...
    YLimits=[-220 50]);
Enable Measurements Data
Enable the phase noise measurements and set the corresponding phase noise properties:
FrequencyOffsetto[30000 100000 1000000 3000000 10000000 19000000]TargetPhaseNoiseto[-56 -106 -132 -143 -152 -160]LabelPhaseNoisetotrue
sa.PhaseNoise.Enabled=true;
sa.PhaseNoise.FrequencyOffset=[30000 100000 1000000 3000000 10000000 19000000];
sa.PhaseNoise.PlotTargetPhaseNoise=true;
sa.PhaseNoise.TargetPhaseNoise=[-56 -106 -132 -143 -152 -160];
sa.PhaseNoise.LabelPhaseNoise=true;
Plot Phase Noise Measurements
Stream in a noisy sinusoidal signal with 2400 samples in each frame, and view its spectrum using the spectrum analyzer. The scope shows the phase noise of the signal in the phase noise axis and the corresponding measurements in the phase noise panel at the bottom. The scope plots the target phase noise profile in a red dashed line.
Use the getMeasurementsData function to obtain the phase noise measurements programmatically. The values shown in the measurement panels match the values shown in data.
data = [];
frameSize = 2400;
sw = dsp.SineWave(SampleRate=Fs,SamplesPerFrame=frameSize);
for idx = 1:10
    noise = 1e-8.*randn(frameSize,1);
    sa(sw() + noise);
    if sa.isNewDataReady
        data = [data;getMeasurementsData(sa)];
    end
end

Version History
Introduced in R2025a