Analyze Truth Data and Define Truth Model
This example shows how to analyze recorded truth data to model the motion of truth objects and configure a filter to track them.
Sources and Types of Truth Data
There are three typical sources of recorded truth data:
Simulation: Data is collected by running a simulated scenario and recording the kinematics of each truth object. The recorded data is perfect, noiseless, can be obtained at any update rate, and is complete in the sense that any kinematic time derivative can be recorded.
Instrumented tests: Data is collected during a flight test where truth objects of interest are instrumented with GPS and inertial measurement units. The recorded data typically has low noise, is recorded at about 1 Hz, and includes a limited number of kinematic derivatives, usually just position and velocity.
Labeled data: Data is collected during uncontrolled tests, for example, by driving on a road. Sensor data is later labeled manually or semi-automatically to generate estimates of the truth. The data typically has a high noise level, might contain erroneous identifications, and can have various update rates.
The example focuses on analyzing recordings of truth objects from simulation and from instrumented tests.
Analyze Simulated Truth
This section focuses on the first case: Truth recorded from simulation. This example is based on the Benchmark Trajectories for Multi-Object Tracking scenario, as described in [1].
Convert the benchmark trajectories scenario into tables that list the time, position, and velocity history for each truth object. The function scenarioToTruth is provided in the supporting functions at the bottom of this script.
load("TruthScenario","scenario"); updateRate =10; includeVelocity =
true; includeAcceleration =
false; truthTables = scenarioToTruth(scenario,UpdateRate=updateRate,includeVelocity=includeVelocity,IncludeAcceleration=includeAcceleration);
Visualize the truth trajectories.
f = figure;
hold on;
for i = 1:numel(truthTables)
    scatter3(truthTables{i}.Position(:,2),truthTables{i}.Position(:,1),-truthTables{i}.Position(:,3),1,lines(1));
end
xlabel('East [m]');
ylabel('North [m]');
zlabel('Up [m]');
view(3);
axis equal;
![Figure contains an axes object. The axes object with xlabel East [m], ylabel North [m] contains 6 objects of type scatter.](../../examples/fusion/win64/AnalyzeTruthDataAndDefineTargetModelExample_01.png)
This shows that the targets are changing direction rapidly, which means that these are maneuvering targets. It is easier to analyze target motion by looking at speeds, rates of change in speed (tangential acceleration), and turns (normal acceleration). The function addManeuvers attached to this script analyzes the truth tables and adds speed, tangential acceleration, and normal acceleration.
The process of analyzing the maneuvers and adding them to the table includes these steps:
If velocity and acceleration are not provided in the truth, complete the data using simple derivatives. For perfect data obtained from simulation this step is trivial.
Compute the speed at each time step using the norm of the velocity vector.
As the recording is in North-East-Down coordinates, use the z-component of the velocity for climb rate.
Use the velocity vector and the acceleration vector at each time step to find the tangential acceleration at that time step.
Compute the normal acceleration from the norm of the acceleration and the tangential acceleration.
truthTables = addManeuvers(truthTables);
It is now easier to observe the maneuvers by using the plotManeuvers function attached to this script. Use the minat and minan values to define the minimum tangential and normal accelerations, respectively, that are considered as maneuvers. In this figure, a blue section represents a constant velocity leg without accelerations, a green section represents flight along a straight line while increasing speed, a red section represents flight along a straight line while decreasing speed, and a yellow section represents turning.
minat =1; % Minimum tangential acceleration, m/s^2 minan =
1; % Minimum normal acceleration, m/s^2 plotManeuvers(f,truthTables,minat,minan);
![Figure contains an axes object. The axes object with xlabel East [m], ylabel North [m] contains 6 objects of type scatter.](../../examples/fusion/win64/AnalyzeTruthDataAndDefineTargetModelExample_02.png)
Summarize the maneuvering limits for each target by using the summarizeManeuvers function attached to this script. Note that the percentages in the table may not add up to 100, because a target can change speed and turn at the same time.
summaryTable = summarizeManeuvers(truthTables,minat,minan)
summaryTable=6×10 table
    Constant Velocity %    Turn %    Speed Change %    Min Speed    Max Speed    Min Climb Rate    Max Climb Rate    Min Tangential Acceleration    Max Tangential Acceleration    Max Normal Acceleration
    ___________________    ______    ______________    _________    _________    ______________    ______________    ___________________________    ___________________________    _______________________

          76.661           23.339             0         289.34       289.71                0                 0                -0.33228                        0.38319                      35.447
          74.446           25.338        3.7277         301.06       305.69          -32.286          0.023165                 -5.4425                         5.2036                      41.087
          73.582            17.45        20.367          274.3       458.75                0                 0                   -14.9                          5.023                      44.198
          56.942           19.287        36.629         251.45       411.71         -0.74238            55.382                 -3.2049                          7.253                      59.918
          32.037           33.117        60.238         274.46       453.79          -1.8727            281.49                  -40.11                         40.893                      72.883
          41.221           28.795        55.592         208.87       426.84          -167.82             1.074                 -13.831                         11.176                      72.561
Analyze Recorded Truth
So far, the analysis used perfect truth, obtained from simulation. While this is useful, a more common case is when targets are instrumented in a test and their GPS position is recorded and analyzed.
Recorded truth has inherent measurement noises, lower update rate, and often has missing measurements.
For the purposes of this example, you simulate these effects using the gpsSensor System object and the helper simulateRecording function.
sampleRate =1 ; % Sampling rate of the instrumentation systems horizontalPositionAccuracy =
1.6; % Horizontal accuracy of the instrumentation systems verticalPositionAccuracy =
3; % Vertical accuracy of the instrumentation systems velocityAccuracy =
0.1; % Velocity accuracy of the instrumentation systems decayFactor =
0.9; % Decay factor of the instrumentation systems gps = gpsSensor(SampleRate=sampleRate, ... HorizontalPositionAccuracy=horizontalPositionAccuracy, ... VerticalPositionAccuracy=verticalPositionAccuracy, ... VelocityAccuracy=velocityAccuracy, ... DecayFactor=decayFactor); recordingProbability =
0.9; % Probability of sample being reported recordedTables = simulateRecording(scenario,gps,recordingProbability);
Smooth Noisy Truth Data
Depending on the amount of noise in the recorded data, you might want to smooth the data before analyzing it. This is an optional step.
To do that, use the MATLAB® Data Cleaner app, and use the Smooth Data option to smooth the recording. This image shows how to navigate to the Data Cleaner app in the MATLAB Window.

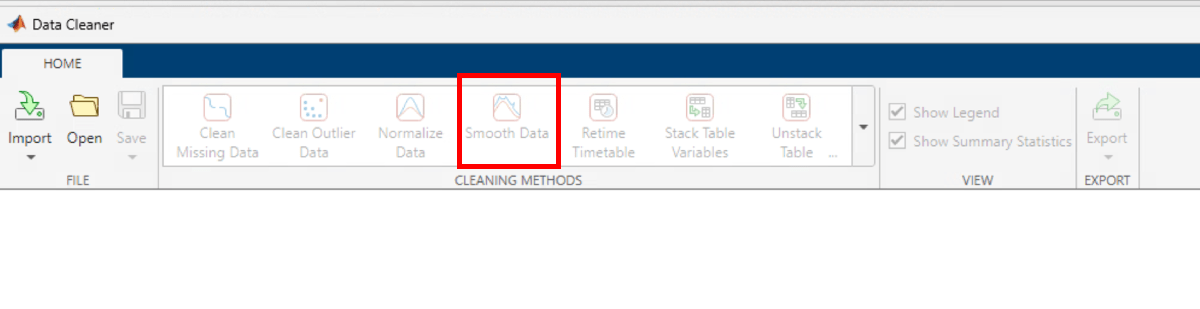
The next image shows how to find the Smooth Data tool inside the Data Cleaner app.
Use the smoothRecording function that was exported from the app and the Gaussian option to smooth the data. The choice of timewindow depends on the data sample rate.
timewindow = 5;
recordedTables = smoothRecording(recordedTables, timewindow);
5;
recordedTables = smoothRecording(recordedTables, timewindow);Analyze the simulated truth for comparison.
recordedTables = addManeuvers(recordedTables);
minat = 1; % Minimum tangential acceleration, m/s^2
minan = 1; % Minimum normal acceleration, m/s^2
plotManeuvers(f,recordedTables,minat,minan);
![Figure contains an axes object. The axes object with xlabel East [m], ylabel North [m] contains 6 objects of type scatter.](../../examples/fusion/win64/AnalyzeTruthDataAndDefineTargetModelExample_05.png)
summaryTable = summarizeManeuvers(recordedTables,minat,minan)
summaryTable=6×10 table
    Constant Velocity %    Turn %    Speed Change %    Min Speed    Max Speed    Min Climb Rate    Max Climb Rate    Min Tangential Acceleration    Max Tangential Acceleration    Max Normal Acceleration
    ___________________    ______    ______________    _________    _________    ______________    ______________    ___________________________    ___________________________    _______________________

          73.143           26.857             0          285.5        289.8          -0.1386          0.099782                -0.77035                        0.89733                      27.344
          70.482           29.518        4.2169         296.23       305.01          -31.969           0.12531                  -1.411                         1.9341                      36.395
          69.822           21.302         20.71         274.39       457.39        -0.091943           0.13917                 -10.988                        0.89954                       37.77
          52.632           26.901        40.351         245.29       411.86         -0.61134            54.704                 -4.1592                         5.6348                       54.84
          29.697           39.394        60.606         282.73       449.24         -0.12708            272.82                 -8.0657                         5.9692                      64.294
          40.237           35.503        56.213         205.31       426.97          -120.24           0.13243                 -10.655                         7.2804                      64.799
As expected, the results of the analyzed recorded data do not perfectly match the simulated truth analysis. In particular, the tangential acceleration values are not accurate, because the recording velocities are noisy. However, the other values give a rough ballpark about the minimum and maximum speeds and even the rough magnitude of the maximum normal acceleration, that is around a 7G turn.
Define Truth Specification
So far, you have analyzed recorded data of multiple truth objects. The next step in defining tracking algorithms is to provide one or more truth specifications that capture this knowledge in a way that enables defining tracking filters and multi-object trackers.
To specify one truth specification based on all targets, use the summaryTable to define ranges of speeds and accelerations.
truthSpec = struct(Speed = [min(summaryTable.("Min Speed")),max(summaryTable.("Max Speed"))], ...
    ClimbRate = [min(summaryTable.("Min Climb Rate")),max(summaryTable.("Max Climb Rate"))], ...
    TangentialAcceleration = [min(summaryTable.("Min Tangential Acceleration")),max(summaryTable.("Max Tangential Acceleration"))], ...
    MaxNormalAcceleration = max(summaryTable.("Max Normal Acceleration")));
disp(truthSpec);
                     Speed: [205.3083 457.3947]
                 ClimbRate: [-120.2439 272.8185]
    TangentialAcceleration: [-10.9879 7.2804]
     MaxNormalAcceleration: 64.7988
There are many ways to define a tracking filter based on this truth specification. For simplicity, use an extended Kalman filter configured with a constant velocity model. Use the first target position and specify a general position measurement uncertainty of 100 meters.
state = zeros(6,1);
state(1:2:5) = recordedTables{1}.Position(1,:);
cvekf = trackingEKF(@constvel,@cvmeas,state, ...
    StateTransitionJacobianFcn=@constveljac, ...
    MeasurementJacobianFcn=@cvmeasjac, ...
    StateCovariance=100^2*eye(6), ...
    HasAdditiveProcessNoise=false, ...
    ProcessNoise = eye(3), ... % Just define the size for now
    HasAdditiveMeasurementNoise=true, ...
    MeasurementNoise = eye(3));
Define the unknown StateCovariance elements related to the velocity, which was not measured in earlier steps, by using the truth specification.
cvekf.StateCovariance(2,2) = truthSpec.Speed(2)^2; % Corresponds to the unknown Vx
cvekf.StateCovariance(4,4) = truthSpec.Speed(2)^2; % Corresponds to the unknown Vy
cvekf.StateCovariance(6,6) = max(abs(truthSpec.ClimbRate)); % % Corresponds to the unknown Vz
disp(cvekf.StateCovariance);
   1.0e+05 *

    0.1000         0         0         0         0         0
         0    2.0921         0         0         0         0
         0         0    0.1000         0         0         0
         0         0         0    2.0921         0         0
         0         0         0         0    0.1000         0
         0         0         0         0         0    0.0027
Similarly, use the acceleration components to define the ProcessNoise. The maximum acceleration is the worst case ProcessNoise, but you can use better estimates.
maxTotalAccelerationSquared = max(abs(truthSpec.TangentialAcceleration))^2+truthSpec.MaxNormalAcceleration^2;
cvekf.ProcessNoise = maxTotalAccelerationSquared * eye(3);
disp(cvekf.ProcessNoise);
   1.0e+03 *

    4.3196         0         0
         0    4.3196         0
         0         0    4.3196
Summary
In this example you learned how to analyze truth data in order to get an estimate of the maneuvers that the targets perform. The results of this analysis can be used to define the right target motion model and provide ranges for speed and accelerations. If used within a tracking filter, these values can form the basis for initializing the filter state covariance and for the process noise.
References
W.D. Blair, G. A. Watson, T. Kirubarajan, Y. Bar-Shalom, "Benchmark for Radar Allocation and Tracking in ECM." Aerospace and Electronic Systems IEEE Trans on, vol. 34. no. 4. 1998.
Supporting Functions
scenarioToTruth records truth tables from the scenario. The function records only truth objects with a trajectory that implements the lookupPose method.
function truthTables = scenarioToTruth(scenario,options)
arguments
    scenario (1,1) trackingScenario
    options.UpdateRate (1,1) double = 100; % Update rate in Hz
    options.IncludeVelocity (1,1) logical = true; % Record velocity
    options.IncludeAcceleration (1,1) logical = false; % Record acceleration
end
startTime = 0;
stopTime = scenario.StopTime;
timestep = 1/options.UpdateRate;
sampleTimes = (startTime:timestep:stopTime);
numTruths = numel(scenario.Platforms);
truthTables = cell(1,numTruths);
includeInOutput = false(1,numTruths);
for i = 1:numTruths
    if ismethod(scenario.Platforms{i}.Trajectory, 'lookupPose')
        includeInOutput(i) = true;
        [pos, ~, vel, acc, ~] = lookupPose(scenario.Platforms{i}.Trajectory, sampleTimes);
        truthTables{i} = table(sampleTimes(:),pos,'VariableNames',["Time","Position"]);
        if options.IncludeVelocity
            truthTables{i} = addvars(truthTables{i}, vel, NewVariableNames = "Velocity");
        end
        if options.IncludeAcceleration
            truthTables{i} = addvars(truthTables{i}, acc, NewVariableNames = "Acceleration");
        end
    end
end
truthTables = truthTables(includeInOutput);
end
addManeuvers adds speed, tangential acceleration, and normal acceleration to the truth table.
function truthTables = addManeuvers(truthTables)
for i = 1:numel(truthTables)
    vel = velocity(truthTables{i});
    if ~ismember('Speed',truthTables{i}.Properties.VariableNames)
        speed = vecnorm(vel,2,2);
        truthTables{i} = addvars(truthTables{i},speed,NewVariableNames="Speed");
    end
    if ~ismember('ClimbRate',truthTables{i}.Properties.VariableNames)
        climbRate = -vel(:,3); % Remember that the data is North-East-Down, so climb rate is -Vz
        truthTables{i} = addvars(truthTables{i},climbRate,NewVariableNames="ClimbRate");
    end
    [at,an] = acceleration(truthTables{i});
    if ~ismember("TangentialAcceleration",truthTables{i}.Properties.VariableNames)
        truthTables{i} = addvars(truthTables{i},at,NewVariableNames="TangentialAcceleration");
    end
    if ~ismember("NormalAcceleration",truthTables{i}.Properties.VariableNames)
        truthTables{i} = addvars(truthTables{i},an,NewVariableNames="NormalAcceleration");
    end
end
end
velocity returns the velocity of a truth object.
function vel = velocity(truth)
arguments
    truth table
end

% Check if there is a column by the name Velocity. If no, use position to find velocity
[hasVelocity,velidx] = ismember('Velocity', truth.Properties.VariableNames);

if hasVelocity
    vel = table2array([truth(:,velidx)]);
else
    dt = diff(truth.Time);
    vel = diff(truth.Position,1,1)./dt;
    vel(end+1,:) = vel(end,:); % Make sure number of rows remains same as the table
end
end
acceleration returns the tangential and normal acceleration components of a truth object.
function [at, an] = acceleration(truth)
arguments
    truth table
end

vel = velocity(truth);
vmag = vecnorm(vel,2,2);
dt = diff(truth.Time);
dt(end+1) = 2*dt(end)-dt(end-1);

% Check if there is a column by the name Acceleration. If no, use velocity
% to find the acceleration
[hasAcc,accidx] = ismember('Acceleration', truth.Properties.VariableNames);
if hasAcc
    acc = table2array([truth(:,accidx)]);
else
    dvel = diff(vel,1,1);
    dvel(end+1,:) = 0;
    acc = dvel./dt;
end

% Compute the tangential acceleration as d|v|/dt
dvmag = diff(vmag,1,1);
dvmag(end+1) = dvmag(end);
at = dvmag./dt;

amag = vecnorm(acc,2,2);
an = sqrt(max(amag.^2-at.^2,0));
end
plotManeuvers plots the maneuvers.
function plotManeuvers(f,truthTables,minat,minan)
clf(f);
hold on
colors = [0     0.447 0.741;... % Blue for constant velocity
          0.1   0.741 0.1;  ... % Green for increasing speed
          0.741 0.1   0.1;  ... % Red for decreasing speed
          0.929 0.694 0.125];   % Yellow for turning
for i = 1:numel(truthTables)
    increasingSpeed = truthTables{i}.TangentialAcceleration > minat;
    decreasingSpeed = truthTables{i}.TangentialAcceleration < -minat;
    changingDirection = abs(truthTables{i}.NormalAcceleration) > minan;
    color = colors(1,:) .* (~increasingSpeed & ~decreasingSpeed & ~changingDirection) + ...
        colors(2,:) .* increasingSpeed + colors(3,:) .* decreasingSpeed + colors(4,:) .* changingDirection;
    scatter3(truthTables{i}.Position(:,2),truthTables{i}.Position(:,1),-truthTables{i}.Position(:,3),1,color);
end
xlabel('East [m]');
ylabel('North [m]');
zlabel('Altitude [m]');
view(3);
axis equal;
end
summarizeManeuvers provides a summary of the maneuvers.
function summaryTable = summarizeManeuvers(truthTables,minat,minan)
names = ["Constant Velocity %", "Turn %", "Speed Change %", ...
    "Min Speed", "Max Speed", "Min Climb Rate", "Max Climb Rate", ...
    "Min Tangential Acceleration", "Max Tangential Acceleration", "Max Normal Acceleration"];
summaryTable = table('Size', [numel(truthTables),numel(names)], VariableTypes=repmat({'double'},1,numel(names)), VariableNames=names);
for i = 1:numel(truthTables)
    numSteps = size(truthTables{i},1);
    summaryTable.(names(1))(i) = 100*nnz(abs(truthTables{i}.TangentialAcceleration) <= minat & truthTables{i}.NormalAcceleration < minan)/numSteps;
    summaryTable.(names(2))(i) = 100*nnz(truthTables{i}.NormalAcceleration > minan)/numSteps;
    summaryTable.(names(3))(i) = 100*nnz(abs(truthTables{i}.TangentialAcceleration) > minat)/numSteps;
    summaryTable.(names(4))(i) = min(truthTables{i}.Speed);
    summaryTable.(names(5))(i) = max(truthTables{i}.Speed);
    summaryTable.(names(6))(i) = min(truthTables{i}.ClimbRate);
    summaryTable.(names(7))(i) = max(truthTables{i}.ClimbRate);
    summaryTable.(names(8))(i) = min(truthTables{i}.TangentialAcceleration);
    summaryTable.(names(9))(i) = max(truthTables{i}.TangentialAcceleration);
    summaryTable.(names(10))(i) = max(truthTables{i}.NormalAcceleration);
end
end
simulateRecording simulates the recording of truths by adding noise, lowering update rate, and dropping some measurements.
function recordedTruth = simulateRecording(scenario,gps,recordingProbability)
arguments
    scenario (1,1) trackingScenario
    gps (1,1) gpsSensor
    recordingProbability (1,1) double {mustBeNonnegative,mustBeLessThanOrEqual(recordingProbability,1)} = 0.99
end

truthTables = scenarioToTruth(scenario,UpdateRate=gps.SampleRate,includeVelocity=false,IncludeAcceleration=false);
recordedTruth = truthTables;
for i = 1:numel(truthTables)
    release(gps);
    truePosition = [truthTables{i}.Position];
    trueVelocity = velocity(truthTables{i});
    [posLLA,vel] = gps(truePosition,trueVelocity);
    posned = lla2ned(posLLA,[0 0 0],"ellipsoid");
    recordedTruth{i}.Position = posned;
    recordedTruth{i}.Velocity = vel;
    includeInOutput = rand(size(truthTables{i},1),1) < recordingProbability;
    recordedTruth{i} = recordedTruth{i}(includeInOutput,:);
end
end
smoothRecording smooths noisy recorded truth data. Note that it was exported from the Data Cleaner app but includes a wrapper to handle multiple recorded truth tables.
function recordedTruth = smoothRecording(recordedTruth, timewindow)
    if isa(recordedTruth,'cell')
        recordedTruth = cellfun(@(t) smoothOneTruth(t,timewindow), recordedTruth, UniformOutput=false);
    else
        recordedTruth = smoothOneTruth(recordedTruth,timewindow);
    end
end

function oneTruth = smoothOneTruth(oneTruth, timewindow)
oneTruth = splitvars(oneTruth,"Position",NewVariableNames=["Position_1","Position_2","Position_3"]);
oneTruth = smoothdata(oneTruth,"gaussian",timewindow);
oneTruth = mergevars(oneTruth,["Position_1","Position_2","Position_3"],...
    NewVariableName = "Position");
if ismember("Velocity",oneTruth.Properties.VariableNames)
    oneTruth = splitvars(oneTruth,"Velocity",NewVariableNames=["Velocity_1","Velocity_2","Velocity_3"]);
    oneTruth = smoothdata(oneTruth,"gaussian",timewindow);
    oneTruth = mergevars(oneTruth,["Velocity_1","Velocity_2","Velocity_3"],...
        NewVariableName = "Velocity");
end
end