Performance
Some of the most common reasons why GPU Coder™ generated code is not performing as expected are:
CUDA® kernels are not created.
Host to device and device to host memory transfers (
cudaMemcpy) are throttling performance.Not enough parallelism or device issues.
These topics elaborate on the common causes for these symptoms and describe how to utilize the built-in screener to detect these issues. You can find information on how to work around for these issues and generate more efficient CUDA code.
Apps
| GPU Coder | Generate CUDA code from MATLAB code |
| GPU Environment Check | Verify and set up GPU code generation environment |
Tools
| GPU Performance Analyzer | Analyze GPU profiling data and identify optimizations (Since R2023a) |
Functions
Objects
Topics
- Code Generation Reports
Create and view reports generated during code generation.
- Trace Between Generated CUDA Code and MATLAB Source Code
Highlight sections of MATLAB® code that runs on the GPU.
- Generating a GPU Code Metrics Report for Code Generated from MATLAB Code
Create and explore GPU static code metrics report.
- Analyzing Network Performance Using the Deep Learning Dashboard
Investigate the performance of deep learning networks and layers in generated code using the Deep Learning Dashboard.
- Kernel Analysis
Recommendations for generating efficient CUDA kernels.
- Memory Bottleneck Analysis
Reduce memory bottleneck issues when using GPU Coder.
- Register Count nvlink Error
Troubleshoot compilation failures due to a register count
nvlinkerror. - Improve Performance of GPU Code by Removing Loop Dependencies
Remove loop dependencies to generate GPU kernels for
for- loops. (Since R2026a) - Identify Function Calls That Prevent Kernel Creation
Identify code that prevents GPU Coder from generating a CUDA kernel for a loop. (Since R2026a)
- Optimize Kernels That Contain Loops
Rewrite loops in MATLAB to avoid generated code kernels that contain loops.
- Prevent Kernel Launches Inside Loops
Parallelize loops that launch kernels to execute them on the GPU.
- Minimize Memory Copy Events in Generated Code Loops
Rewrite loops to minimize the number of data transfers between the CPU and GPU in generated CUDA code.
Featured Examples

Pass GPU Inputs to Entry-Point Functions
Generate code that receives data from the GPU to avoid unnecessary memory copies.
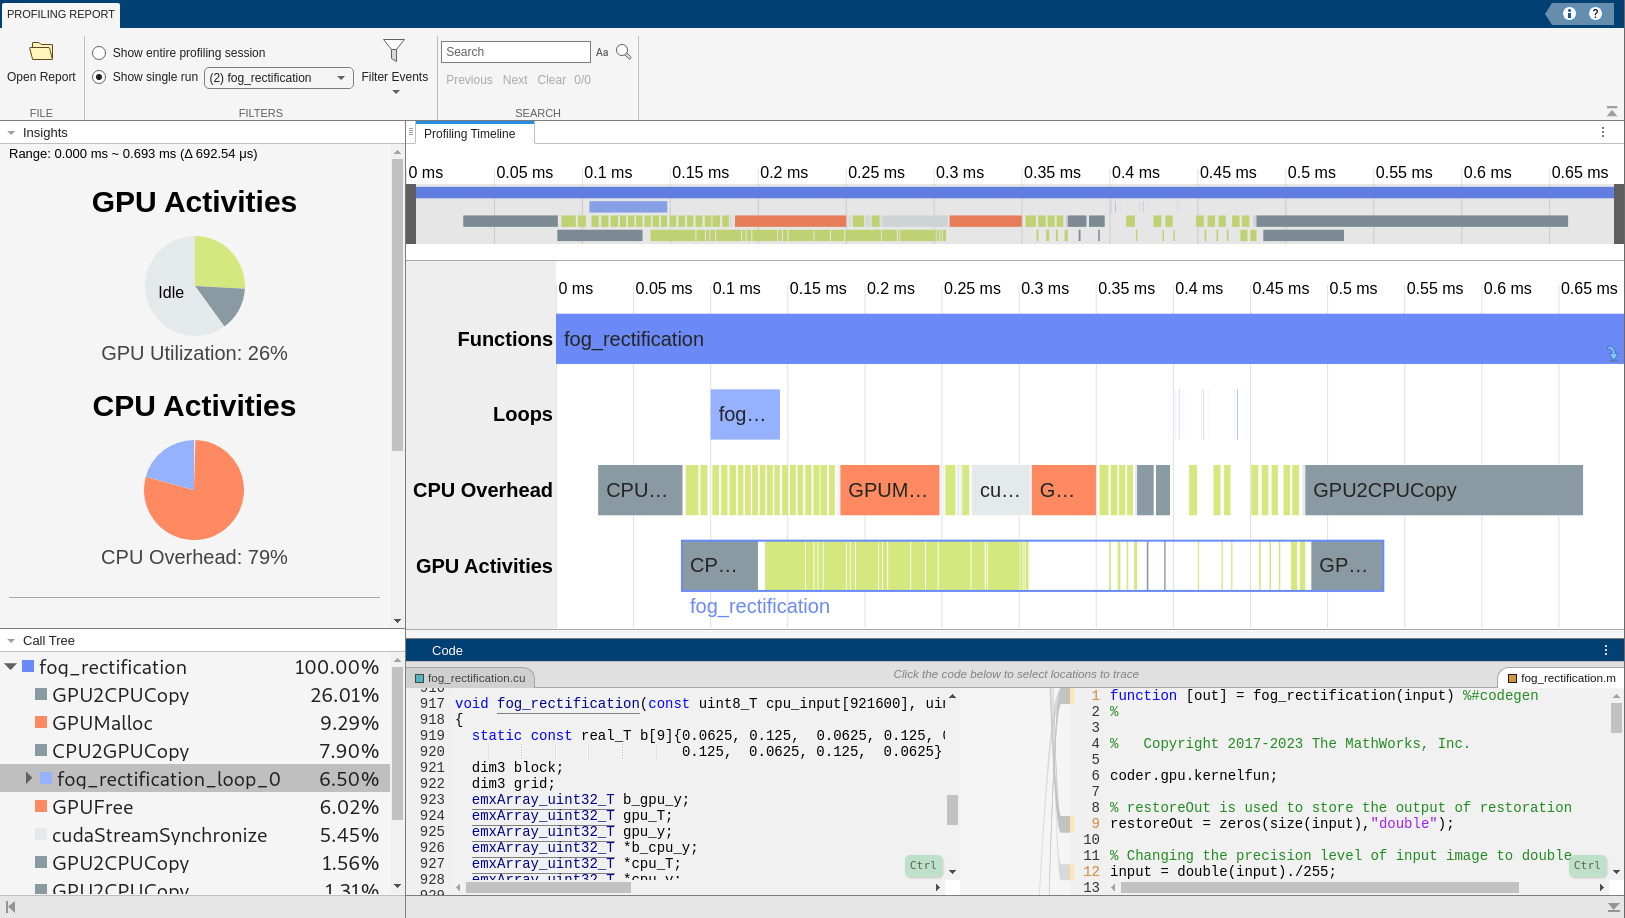
Profile Generated CUDA MEX Functions Using Performance Analyzer
Visualize code metrics and identify optimization and tuning opportunities in generated CUDA MEX.
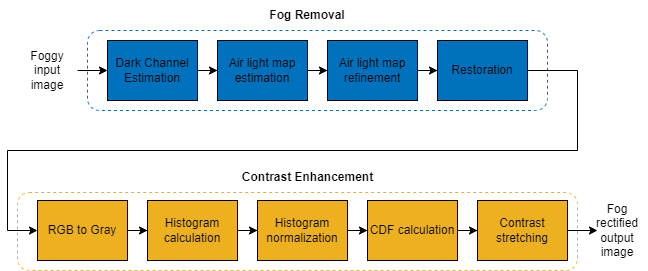
Profile and Optimize Generated GPU Code
Profile and optimize generated GPU code using the GPU Performance Analyzer. You can use the GPU Performance Analyzer to generate code, profile the code, and detect performance bottlenecks. Use the performance diagnostics from the analyzer to modify the original MATLAB® function and improve performance of generated CUDA® code.

GPU Profiling on NVIDIA Jetson Platforms
Analyze and optimize the performance of the generated CUDA code on the Jetson™ platform.

Analyze Performance of Code Generated for Deep Learning Networks
Analyze the performance of the generated CUDA code for deep learning networks.