Industrial Process Monitoring Using MQTT
This example shows how to monitor an industrial process using the MQTT Client blocks in Simulink®. You can connect to an MQTT broker using a Simulink model that acts as an MQTT client. You can publish messages to an MQTT topic using the MQTT Client Publish block and read messages from a topic using the MQTT Client Subscribe block.
MQTT offers advantages in industrial environments by providing a lightweight, efficient, and reliable protocol for real-time data transmission, ensuring minimal bandwidth usage and robust communication even over unreliable networks. In this example, you use the MQTT protocol in Simulink® to monitor the temperature, pressure, and payload weight of a machine on the shop floor.
Prerequisites
This example uses a private MQTT broker. You can run the example by configuring the client to connect to any public MQTT broker, such as ThingSpeak, HiveMQ, Mosquitto, or Eclipse. For more information, see Configure MQTT Client in Simulink.
Modify your security and last will and testament settings. For secure communication, configure a username and password or a certificate to authenticate the connection to the broker. In addition, you can configure the last will and testament (LWT) feature on your client to send a notification in the event of disconnection or disruption. For more information, see Step 2 (Optional): Configure Authentication and Last Will and Testament for MQTT Client.
Model Description
The MonitorIndustrialProcess model provided with this example contains these blocks:
Subsystem block Generates sensor data and publishes the values to an MQTT topic. The Subsystem block contains Uniform Random Number blocks that are used to generate sensor data for the temperature, pressure, and payload weight. These generated values are published to an MQTT topic using an MQTT Client Publish block. The Subsystem block containing this setup is labeled
Sensor Input Simulator.MQTT Client Subscribe block Reads sensor data by subscribing to specific MQTT topics on an MQTT broker.
Dashboard and Scope blocks Visualizes the sensor data.
This image shows the top-level view of the MonitorIndustrialProcess model.

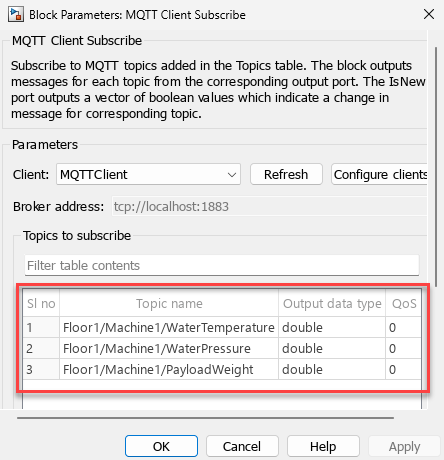
The image shows the parameter window of the MQTT Client Subscribe block. In this example, the block subscribes to three topics and reads data from them. The topics contain current sensor values for the temperature, pressure, and payload weight of the machine.
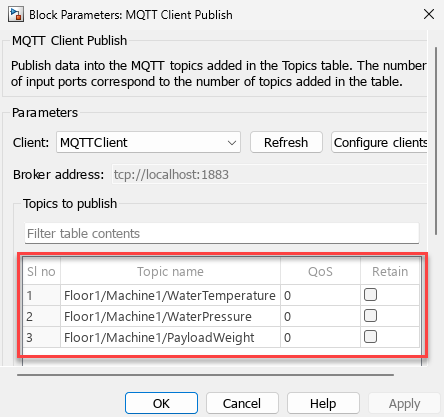
The image shows the parameter window of the MQTT Client Publish block. In this example, the block publishes the current sensor data to three specific MQTT topics on an MQTT broker. The values published to these topics indicate the current temperature, pressure, and payload weight within the machine.
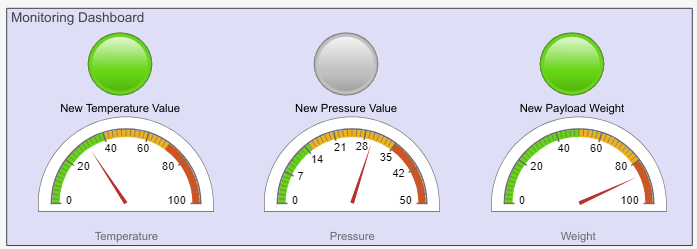
The dashboard blocks visualize the current state of the machine on the shop floor. The Half Gauge (Simulink) blocks display the current values of the temperature, pressure, and payload weight within the machine. The Lamp (Simulink) blocks are triggered when any of the machine parameters change, indicating the need for manual intervention.
Understand Simulation Results
View the sensor data in the monitoring dashboard. This dashboard shows the variation in temperature, pressure, or payload weight within the machine, and highlights any changes in these parameters.
On the dashboard, a change in parameter value triggers the relevant lamp to turn on. The gauges allow you to visually inspect whether any new value remains within the accepted range. The green portion of the gauge indicates optimal, yellow indicates slightly above optimal, and red indicates critical. If the new value is beyond the optimal range, you can recalibrate the machine to return it to its optimal state. This image shows the dashboard state when the payload weight is in the critical range and needs manual intervention to reduce it.