Interactively Identify Geographic Locations
Find the latitude-longitude coordinates of locations on a map by interactively selecting the locations.
This page shows how to create similar maps using map axes (since R2023a) and axesm-based maps. For a comparison of map axes and axesm-based maps, including when to use each type of display, see Choose a 2-D Map Display.
Load Data
Read a shapefile containing world land areas into the workspace.
land = readgeotable("landareas.shp");Find Coordinates on Map Axes
Interactively identify locations on map axes by using the ginput function.
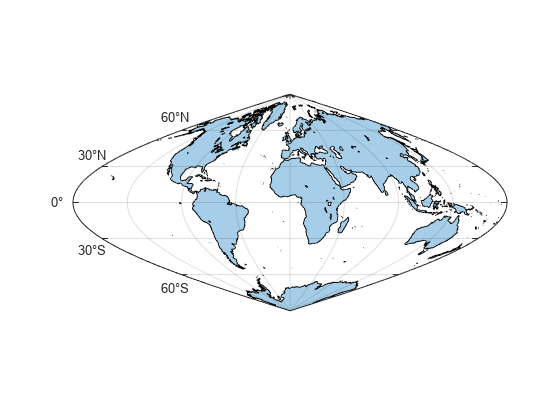
Create a new map that uses a sinusoidal projection. Create the projected CRS using the ESRI code 54008. Provide geographic context for the map by displaying the land areas.
figure
proj = projcrs(54008,Authority="ESRI");
newmap(proj)

geoplot(land)
hold on
Identify the coordinates of four locations. To use predefined points, specify interactivelySelectLocations as false. To interactively select the locations, specify interactivelySelectLocations as true.
interactivelySelectLocations = false;
if interactivelySelectLocations
    [lat,lon] = ginput(4);
else
    lat = [38 -12 20 34];
    lon = [-98 -55 17 89];
end
Display the locations on the map.
geoscatter(lat,lon,"filled")
Alternatively, you can return the current mouse position on a map axes by using the CurrentPoint property of the axes, as in get(gca,"CurrentPoint").
Find Coordinates on axesm-Based Maps
Interactively identify locations on axesm-based maps by using the inputm function.
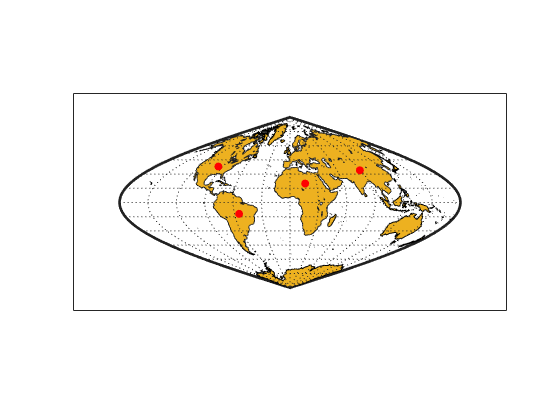
Create an axesm-based map that uses a sinusoidal projection. Provide geographic context for the map by displaying the land areas.
figure
axesm sinusoid
framem on
gridm on
geoshow(land)

Identify the coordinates of four locations. To use predefined points, specify interactivelySelectLocations as false. To interactively select the locations, specify interactivelySelectLocations as true.
interactivelySelectLocations = false;
if interactivelySelectLocations
    [lat,lon] = inputm(4);
else
    lat = [38 -12 20 34];
    lon = [-96 -55 17 89];
end
Display the locations on the map.
scatterm(lat,lon,"filled","r")
At each location, calculate the area scale and the maximum angular deformation of the map projection. The result indicates that the sinusoid projection preserves area, but has variable angular distortion across the map (less distortion near the equator and more distortion near the poles).
[areascale,maxangdef] = distortcalc(lat,lon)
areascale = 1×4

    1.0000    1.0000    1.0000    1.0000
maxangdef = 1×4

   54.5671   11.3974    5.8094   46.9515
Alternatively, you can return the current mouse position on an axesm-based map by using the gcpmap function. This function is analogous to get(gca,"CurrentPoint").
See Also
Functions
newmap|geoscatter|axesm|scatterm|distortcalc