contour3m
Project 3-D contour plot of map data
Syntax
Description
contour3m(___, specifies
the contour lines to display, in addition to any combination of arguments from the previous
syntaxes.levels)
contour3m(___,
specifies additional options for the contour plot using one or more name-value
arguments.Name,Value)
C = contour3m(___)C, which contains the latitude and longitude coordinates
of the vertices at each level.
Examples
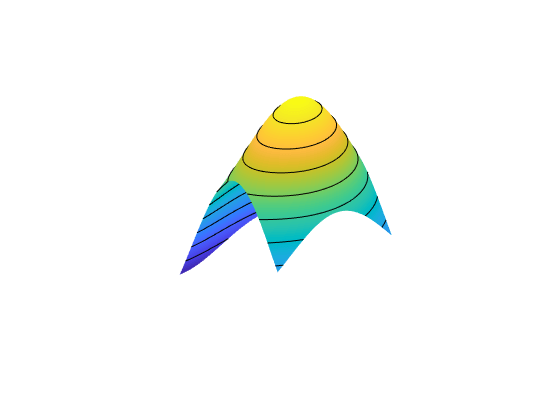
Display sample map data as a surface on a map. Then, display 3-D contours of the sample data on the same map.
R = georefpostings([10 50],[60 100],[100 100]);
Z = geopeaks(R);

figure
axesm miller
axis off

geoshow(Z,R,"DisplayType","surface")
contour3m(Z,R,"k")
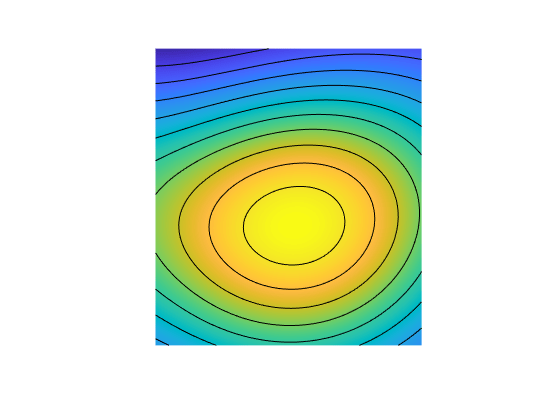
Exaggerate the z-axis of the axes. Then, view the map in 3-D.
daspect([1 1 5])
view(3)
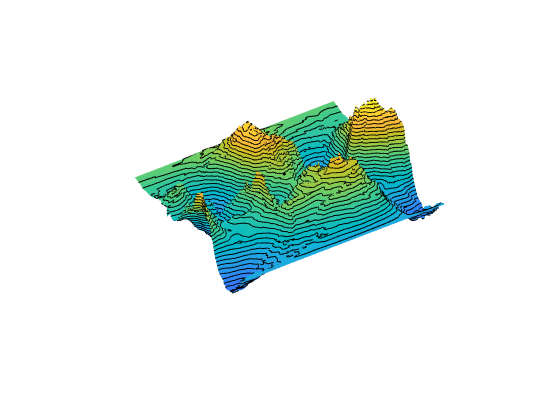
Read geoid heights from the Earth Gravitational Model of 1996 (EGM96) into the workspace. Display the data as a surface on a map. Then, display contours at 40 levels of Z.
[Z,R] = egm96geoid;

figure
axesm miller
axis off

geoshow(Z,R,"DisplayType","surface")
contour3m(Z,R,40,"k")
Exaggerate the z-axis of the axes. Then, view the map in 3-D.
daspect([1 1 50])
view(3)
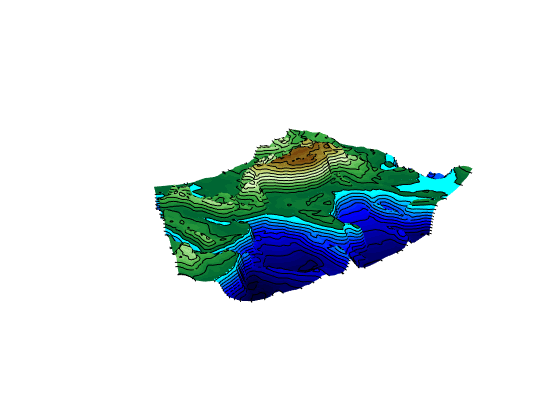
Load global elevation and bathymetry data. Crop the data to include an area around South Asia.
load topo60c
latlim = [0 50];
lonlim = [35 115];
[Z,R] = geocrop(topo60c,topo60cR,latlim,lonlim);
Display the data as a surface, using a colormap appropriate for elevation data. Then, create a 3-D contour plot on top of the surface. Display contour lines at increments of 500 meters.
figure
axesm("lambertstd","MapLatLimit",latlim,"MapLonLimit",lonlim)
axis off
tightmap

geoshow(Z,R,"DisplayType","surface")
demcmap(Z)
contour3m(Z,R,"k","LevelStep",500)
Exaggerate the z-axis of the axes. Then, view the map in 3-D.
daspect([1 1 40000])
view(3)
Input Arguments
Regular or geolocated data grid, specified as an M-by-N matrix.
The contour3m function does not display contour lines for
elements of Z that have values of NaN.
Raster reference for Z, specified as a GeographicCellsReference or GeographicPostingsReference object. The RasterSize
property of R must be consistent with
size(Z).
Latitude coordinates, specified as an M-by-N matrix or an M-element vector.
This argument does not support NaN values. To indicate missing
data, set the corresponding element of Z to a value of
NaN, instead.
Longitude coordinates, specified as an M-by-N matrix or an M-element vector.
This argument does not support NaN values. To indicate missing
data, set the corresponding element of Z to a value of
NaN, instead.
Contour levels, specified as a positive integer or a numeric vector.
To display contour lines at
nautomatically chosen levels, specify this argument asn. The function chooses levels based on the values inZ.To display contour lines at specific levels, specify this argument as a vector of increasing values.
To display contour lines at a single level,
k, specify this argument as a two-element row vector[k k].
Line style and color, specified as a character vector or string scalar containing characters
and symbols. The characters and symbols can appear in any order. You can specify the
line style, line color, or both. Marker symbols such as 'o' are
ignored.
Example: '--g' is a green dashed line.
| Line Style | Description | Resulting Line |
|---|---|---|
"-" | Solid line |
|
"--" | Dashed line |
|
":" | Dotted line |
|
"-." | Dash-dotted line |
|
| Color Name | Short Name | Appearance |
|---|---|---|
'red' | 'r' |
|
'green' | 'g' |
|
'blue' | 'b' |
|
'cyan'
| 'c' |
|
'magenta' | 'm' |
|
'yellow' | 'y' |
|
'black' | 'k' |
|
'white' | 'w' |
|
Name-Value Arguments
Specify optional pairs of arguments as
Name1=Value1,...,NameN=ValueN, where Name is
the argument name and Value is the corresponding value.
Name-value arguments must appear after other arguments, but the order of the
pairs does not matter.
Example: contour3m(Z,R,ShowText="on") displays the contour line
labels.
Before R2021a, use commas to separate each name and value, and enclose
Name in quotes.
Example: contour3m(Z,R,"ShowText","on") displays the contour line
labels.
Note
In addition to the name-value arguments in this section, you can use name-value
arguments to specify values for the HandleVisibility,
Parent, Tag, UserData,
and Visible properties of the Group object returned
by this function. For more information about these group object properties, see Group Properties.
Fill between the contour lines, specified as one of these values:
"off"— Do not fill the spaces between contour lines with a color."on"— Fill the spaces between contour lines with color.
Label spacing along the contour lines, specified as a scalar value in points, where one point is 1/72 inch. Use this property to control the number of contour labels along the contour lines. Smaller values produce more labels.
You must specify ShowText as "on" for
LabelSpacing to have an effect.
If the length of a contour line is less than LabelSpacing,
then the function displays one label on the line.
Contour levels, specified as a row vector of increasing values in
Z. By default, the contour3m function
chooses values that span the range of values in Z.
Spacing between the contour lines, specified as a positive scalar. For example,
specify a value of 2 to display contour lines at increments of
2. By default, the contour3m function
determines the spacing based on the values in Z. If you specify
both levels and LevelStep, then the function
ignores LevelStep.
Color of the contour lines, specified as "flat", a color name,
a short name, an RGB triplet, or "none". The default value of
"flat" selects a distinct color for lines at each contour level
from the colormap of the figure in which the contours are drawn. The value
"none" applies no color to the lines.
For a custom color, specify an RGB triplet. An RGB triplet is a three-element row
vector whose elements specify the intensities of the red, green, and blue components
of the color. The intensities must be in the range [0,1]; for
example, [0.4 0.6 0.7].
Alternatively, you can specify some common colors by name. This table lists the named color options and equivalent RGB triplets.
| Color Name | Short Name | RGB Triplet | Appearance |
|---|---|---|---|
"red" | "r" | [1 0 0] |
|
"green" | "g" | [0 1 0] |
|
"blue" | "b" | [0 0 1] |
|
"cyan"
| "c" | [0 1 1] |
|
"magenta" | "m" | [1 0 1] |
|
"yellow" | "y" | [1 1 0] |
|
"black" | "k" | [0 0 0] |
|
"white" | "w" | [1 1 1] |
|
Line style, specified as one of the options listed in this table.
| Line Style | Description | Resulting Line |
|---|---|---|
"-" | Solid line |
|
"--" | Dashed line |
|
":" | Dotted line |
|
"-." | Dash-dotted line |
|
"none" | No line | No line |
Contour line width, specified as a positive scalar in points. One point equals 1/72 inch.
Contour line labels, specified as one of these values:
"on"— Display the contour level along the contour lines."off"— Do not label the contour lines.
Output Arguments
Tips
When you use the
contour3mfunction with anaxesm-based map that contains aglobemap frame, thecontour3mfunction issues a warning.The
contour3mfunction behaves the same as thecontourmfunction, except thecontour3mfunction displays the lines for each contour level at the z-coordinate equal to the value of the level.