worldGrid
Description
[,
where X,Y] = worldGrid(R,gridOption)gridOption is "gridvectors", returns
X and Y as row vectors. The coordinates of
raster element (i,j) are (X(j),Y(i)). The default for
gridOption is "fullgrid", which returns
X and Y as 2-D arrays.
Examples
Import elevation data, find the coordinates of the imported data, then display the data as a surface.
First import elevation data [1] for an area around Mount Washington as an array and a map cells reference object. Prepare the data for plotting by specifying the output type as "double".
[Z,R] = readgeoraster("MtWashington-ft.grd",OutputType="double");
Find the coordinates of each element in the array.
[X,Y] = worldGrid(R);
Display the elevation data as a surface using an appropriate colormap. Set the EdgeColor property to "none" to remove the mesh from the surface.
surf(X,Y,Z,EdgeColor="none") demcmap(Z) xlabel("x (meters)") ylabel("y (meters)") zlabel("Elevation (feet)")

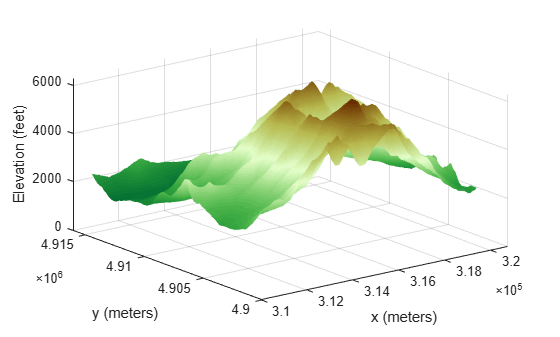
[1] The elevation data used in this example is courtesy of the U.S. Geological Survey.
Create a map cells reference object for a 3-by-4 raster with x values in the range [7000, 7400] meters and y values in the range [2700, 3300] meters. Get the coordinates of the raster elements and return them as row vectors.
R = maprefcells([7000 7400],[2700 3300],[3 4]);
[X,Y] = worldGrid(R,'gridvectors')X = 1×4
7050 7150 7250 7350
Y = 1×3
2800 3000 3200
If you do not specify the second argument as 'gridvectors', then the worldGrid function returns 2-D arrays by default.
[xFull,yFull] = worldGrid(R)
xFull = 3×4
7050 7150 7250 7350
7050 7150 7250 7350
7050 7150 7250 7350
yFull = 3×4
2800 2800 2800 2800
3000 3000 3000 3000
3200 3200 3200 3200
Input Arguments
Spatial reference, specified as a MapCellsReference or MapPostingsReference object.
If R is a MapCellsReference object, then
X and Y are cell centers. If
R is a MapPostingsReference object, then
X and Y are posting points.
Grid option, specified as one of these values:
"fullgrid"— ReturnXandYas 2-D arrays, where each row ofXis identical and each column ofYis identical. This is the default behavior."gridvectors"— ReturnXandYas row vectors. Use this option when you want to reduce memory usage and when 2-D arrays are unnecessary, such as when plotting large data sets with thesurffunction. You can specifygridOptionas"gridvectors"only when theTransformationTypeproperty ofRhas a value of"rectilinear".
This table shows the difference between "fullgrid" and
"gridvectors".
"fullgrid" | "gridvectors" |
|---|---|
R = maprefcells([7000 7400],[2700 3300],[3 4]); [X,Y] = worldGrid(R) X =
7050 7150 7250 7350
7050 7150 7250 7350
7050 7150 7250 7350
Y =
2800 2800 2800 2800
3000 3000 3000 3000
3200 3200 3200 3200 |
R = maprefcells([7000 7400],[2700 3300],[3 4]);
[X,Y] = worldGrid(R,"gridvectors")X =
7050 7150 7250 7350
Y =
2800 3000 3200
|
Data Types: char | string
Output Arguments
x-coordinates, returned as a 2-D array or a row vector. By
default, X is a 2-D array. To return X as a
row vector, specify gridOption as
"gridvectors".
By default, and when gridOption is
"fullgrid", the sizes of X and
Y each equal the RasterSize property of
R. When gridOption is
"gridvectors", the lengths of X and
Y equal the second and first elements of the
RasterSize property of R,
respectively.
y-coordinates, returned as a 2-D array or a row vector. By
default, Y is a 2-D array. To return Y as a
row vector, specify gridOption as
"gridvectors".
By default, and when gridOption is
"fullgrid", the sizes of X and
Y each equal the RasterSize property of
R. When gridOption is
"gridvectors", the lengths of X and
Y equal the second and first elements of the
RasterSize property of R,
respectively.
Version History
Introduced in R2021a
See Also
Functions
Objects
MATLAB Command
You clicked a link that corresponds to this MATLAB command:
Run the command by entering it in the MATLAB Command Window. Web browsers do not support MATLAB commands.
Seleziona un sito web
Seleziona un sito web per visualizzare contenuto tradotto dove disponibile e vedere eventi e offerte locali. In base alla tua area geografica, ti consigliamo di selezionare: .
Puoi anche selezionare un sito web dal seguente elenco:
Come ottenere le migliori prestazioni del sito
Per ottenere le migliori prestazioni del sito, seleziona il sito cinese (in cinese o in inglese). I siti MathWorks per gli altri paesi non sono ottimizzati per essere visitati dalla tua area geografica.
Americhe
- América Latina (Español)
- Canada (English)
- United States (English)
Europa
- Belgium (English)
- Denmark (English)
- Deutschland (Deutsch)
- España (Español)
- Finland (English)
- France (Français)
- Ireland (English)
- Italia (Italiano)
- Luxembourg (English)
- Netherlands (English)
- Norway (English)
- Österreich (Deutsch)
- Portugal (English)
- Sweden (English)
- Switzerland
- United Kingdom (English)