readBasemapImage
Syntax
Description
[
reads an image A,R,attrib] = readBasemapImage(basemap,latlim,lonlim)A from the basemap specified by
basemap for the geographic limits specified by
latlim and lonlim. The output argument
R contains the raster reference for the array and the output argument
attrib contains the basemap attribution. This syntax returns an image
using the highest possible zoom level with a maximum size of
2048-by-2048-by-3.
[___] = readBasemapImage(___,
reads the basemap for the zoom level specified by zoomLevel)zoomLevel. You can
use the zoomLevel argument with any combination of input arguments from
the previous syntaxes.
[___] = readBasemapImage(
reads the basemap at the specified map center and zoom level and returns an image of size
basemap,mapCenter,zoomLevel,rasterSize)rasterSize.
Examples
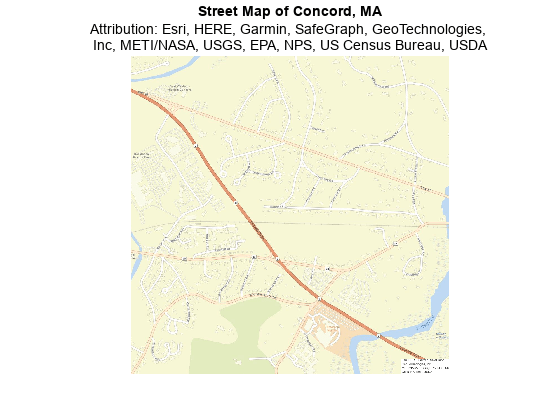
Read an image of the "streets" basemap for an area in Concord, MA. Specify the area using latitude and longitude limits.
latlim = [42.4495 42.4675];
lonlim = [-71.3906 -71.3662];
[A,RA,attribA] = readBasemapImage("streets",latlim,lonlim);
Display the image on a map with no axis labels.
figure
mapshow(A,RA)
axis off
Add a title and subtitle. Wrap the attribution text.
title("Street Map of Concord, MA")

tA = "Attribution: " + attribA;
tA = string(textwrap(tA,65));
subtitle(tA)
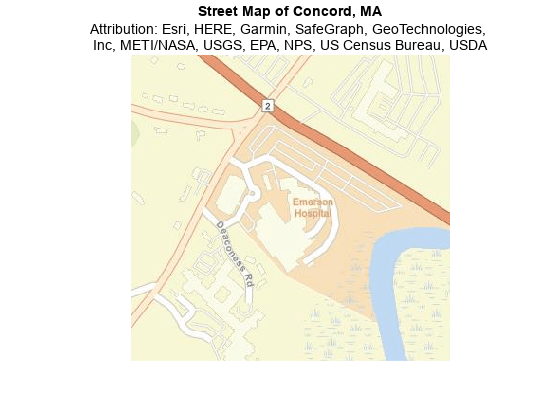
The text is difficult to read because the resolution of the image is greater than the resolution of the figure. View the details of the image by zooming in. Zoom in to an area around a hospital by changing the xy-limits of the map. Specify the limits in world coordinates.
xlim([-7945900 -7945099])
ylim([5228520 5229321])
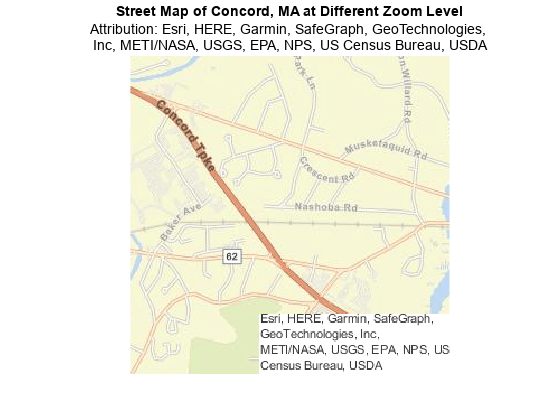
Alternatively, you can improve the readability of the map by reading the basemap image at a different zoom level. Read another basemap image using a zoom level of 14.
[B,RB,attribB] = readBasemapImage("streets",latlim,lonlim,14);

figure
mapshow(B,RB)
axis off

title("Street Map of Concord, MA at Different Zoom Level")

tB = "Attribution: " + attribB;
tB = string(textwrap(tB,65));
subtitle(tB)
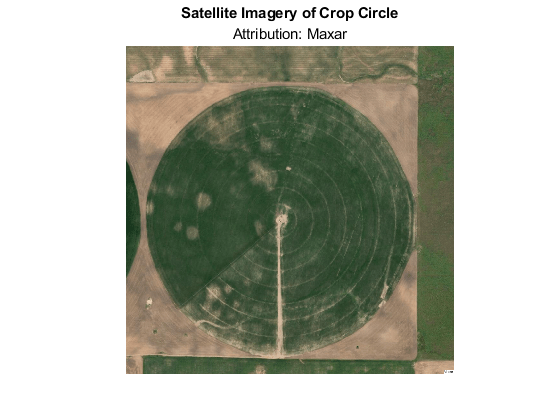
Read an image for an area surrounding a crop circle from the "satellite" basemap.
mapcenter = [37.7149 -98.5954];
[A,RA,attribA] = readBasemapImage("satellite",mapcenter);
Display the image on a map with no axis labels.
figure
mapshow(A,RA)
title("Satellite Imagery of Crop Circle")
subtitle("Attribution: " + attribA)
axis off
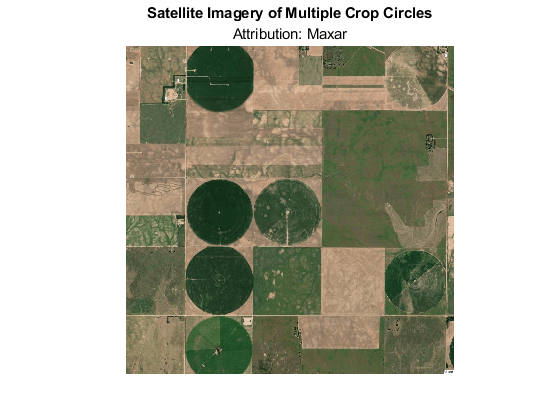
The readBasemapImage function reads the image using the highest possible zoom level. Capture a larger area by using a different zoom level. Read another basemap image using a zoom level of 15.
[B,RB,attribB] = readBasemapImage("satellite",mapcenter,15);

figure
mapshow(B,RB)
title("Satellite Imagery of Multiple Crop Circles")
subtitle("Attribution: " + attribB)
axis off
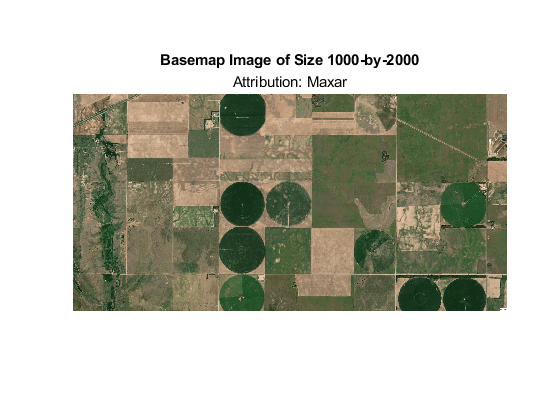
Read an image of size 1000-by-2000 from the "satellite" basemap. Center the image around a crop circle and use a basemap zoom level of 15.
rasterSize = [1000 2000];
[A,RA,attrib] = readBasemapImage("satellite",[37.7149 -98.5954],15,rasterSize);
Display the image on a map with no axis labels.
figure
mapshow(A,RA)
title("Basemap Image of Size 1000-by-2000")
subtitle("Attribution: " + attrib)
axis off
Add the OpenStreetMap® [1] basemap to the list of basemaps available for use with mapping functions. After you add the basemap, you do not need to add it again in future sessions.
name = "openstreetmap";
url = "https://basemaps.arcgis.com/arcgis/rest/services/" + ...
    "OpenStreetMap_v2/VectorTileServer/tile/${z}/${y}/${x}.pbf";
style = "https://www.arcgis.com/sharing/rest/content/items/" + ...
    "3e1a00aeae81496587988075fe529f71/resources/styles/root.json?f=pjson";
addCustomBasemap(name,url,Style=style)
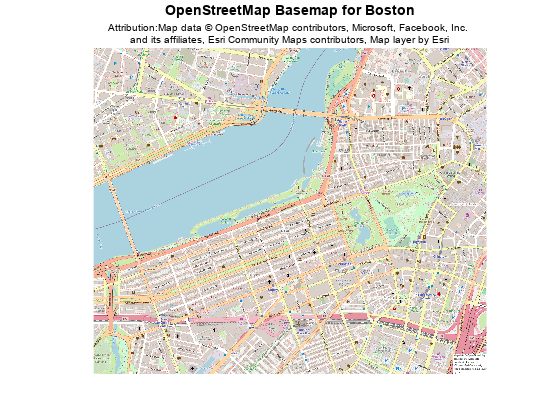
Read an image of the OpenStreetMap basemap for an area in Boston.
latlim = [42.3441 42.3658];
lonlim = [-71.0939 -71.0585];
[A,RA,attrib] = readBasemapImage(name,latlim,lonlim);
Display the image on a map with no axis labels. Wrap the subtitle text.
figure
mapshow(A,RA)
axis off
title("OpenStreetMap Basemap for Boston")

t = "Attribution:" + attrib;
t = string(textwrap(t,80));
subtitle(t)
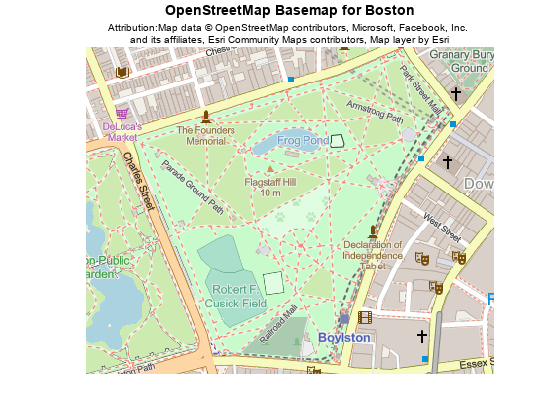
View details of the image for an area around Boston Common by changing the xy-limits.
xlim([-7.9115e+06 -7.9105e+06])
ylim([5.2139e+06 5.2147e+06])
[1] "OpenStreetMap - Overview." ArcGIS Online. Accessed December 8, 2022. https://www.arcgis.com/home/item.html?id=3e1a00aeae81496587988075fe529f71.
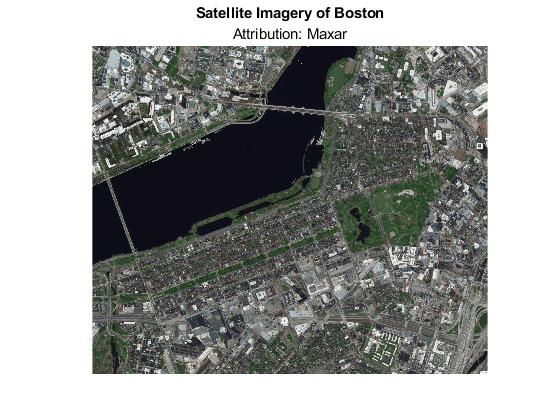
Read an image of the "satellite" basemap for an area in Boston.
latlim = [42.3441 42.3658];
lonlim = [-71.0939 -71.0585];
[A,RA,attribA] = readBasemapImage("satellite",latlim,lonlim);
Save the image as a GeoTIFF file by using the geotiffwrite function.
The
readBasemapImagefunction spatially references the image using the Web Mercator projected coordinate reference system (CRS) with EPSG code3857. Specify the CRS by using theCoordRefSysCodename-value argument.Include the attribution by specifying the
ImageDescriptionTIFF tag.
tag = struct("ImageDescription",attribA);
geotiffwrite("satelliteBoston.tif",A,RA,CoordRefSysCode=3857,TiffTags=tag)
Read the GeoTIFF file and display it on a map with no axis labels.
[B,BR] = readgeoraster("satelliteBoston.tif");
figure
mapshow(B,BR)
title("Satellite Imagery of Boston")
axis off
Read the attribution from the GeoTIFF file and display it in a subtitle.
info = imfinfo("satelliteBoston.tif");
attribB = info.ImageDescription;
subtitle("Attribution: " + attribB)
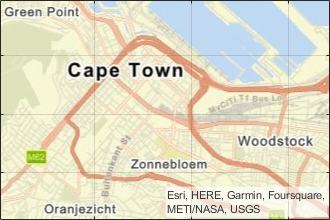
When the opacity of a basemap obscures your data, you can attract attention to the data rather than the basemap by making the basemap transparent.
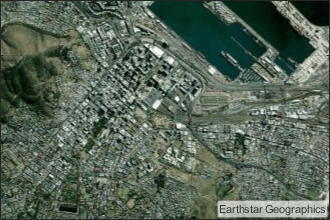
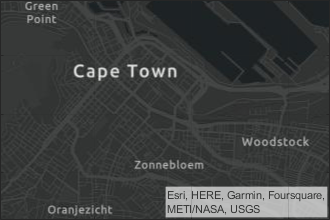
Read an image of the "satellite" basemap for an area around the MathWorks Lakeside Campus in Natick, MA.
latlim = [42.2994 42.3035];
lonlim = [-71.3774 -71.3729];
[A,RA,attrib] = readBasemapImage("satellite",latlim,lonlim,17);
Display the image on a map with no axis labels. Specify an output argument for the mapshow function so you can access the image object it returns.
figure
h = mapshow(A,RA);
hold on
title("Satellite Imagery of Lakeside Campus")
subtitle("Attribution: " + attrib)
axis off
![]()
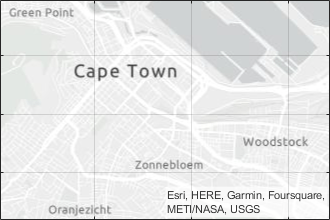
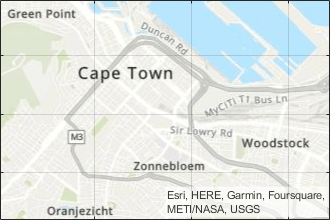
Make the image semi-transparent by setting the AlphaData property of the image object to a value between 0 and 1.
h.AlphaData = 0.6;
![]()
Input Arguments
Basemap, specified as one of the values listed in the table. Six of the basemaps in the table are tiled data sets created using Natural Earth. Five of the basemaps are high-zoom-level maps hosted by Esri®.
|
|
Full global basemap composed of high-resolution satellite imagery. Hosted by Esri. |
|
General-purpose road map that emphasizes accurate, legible styling of roads and transit networks. Hosted by Esri. |
|
|
Map designed to provide geographic context while highlighting user data on a light background. Hosted by Esri. |
|
Map designed to provide geographic context while highlighting user data on a dark background. Hosted by Esri. |
|
|
General-purpose map with styling to depict topographic features. Hosted by Esri. |
|
Map that combines satellite-derived land cover data, shaded relief, and ocean-bottom relief. The light, natural palette is suitable for thematic and reference maps. Created using Natural Earth. |
|
|
Shaded relief map blended with a land cover palette. Humid lowlands are green and arid lowlands are brown. Created using Natural Earth. |
|
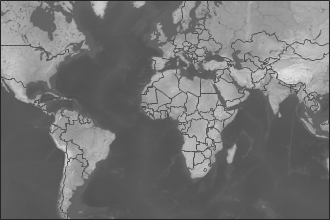
Terrain map in shades of gray. Shaded relief emphasizes both high mountains and micro-terrain found in lowlands. Created using Natural Earth. |
|
|
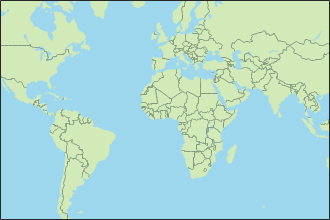
Two-tone, land-ocean map with light green land areas and light blue water areas. Created using Natural Earth. |
|
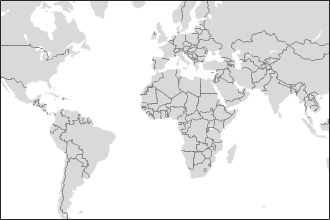
Two-tone, land-ocean map with gray land areas and white water areas. Created using Natural Earth. |
|
|
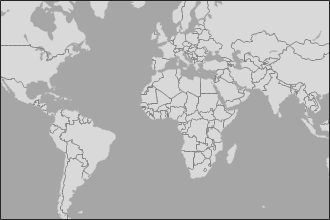
Two-tone, land-ocean map with light gray land areas and dark gray water areas. This basemap is installed with MATLAB®. Created using Natural Earth. | Not applicable. | Custom basemap added using the |
All basemaps except "darkwater" require internet access. The
"darkwater" basemap is included with MATLAB and Mapping Toolbox™.
If you do not have consistent access to the internet, you can download the basemaps created using Natural Earth onto your local system by using the Add-On Explorer. The basemaps hosted by Esri are not available for download. For more information about downloading basemaps, see Use Basemaps in Offline Environments.
The basemaps hosted by Esri update periodically. As a result, you might see differences in your visualizations over time.
Alignment of boundaries and region labels are a presentation of the feature provided by the data vendors and do not imply endorsement by MathWorks®.
Latitude limits, specified as a numeric two-element vector of the form
[slat nlat], where slat is the southern limit in
degrees and nlat is the northern limit in degrees. Both
slat and nlat must be in the range [–90,
90].
Latitude limits, specified as a numeric two-element vector of the form
[wlon elon], where wlon is the western limit in
degrees and elon is the eastern limit in degrees.
Map center, specified as a numeric two-element vector containing latitude and longitude coordinates.
Zoom level, specified as a numeric scalar in the range [0, 25].
The readBasemapImage function rounds the zoom level to the
nearest integer.
The readBasemapImage reduces the zoom level in these situations:
When you specify a zoom level that makes the output argument
Abigger than the maximum allowable size.When you specify a zoom level that is greater than the maximum zoom level of the basemap. The basemaps hosted by Esri have a maximum zoom level of
25. The basemaps created using Natural Earth have a maximum zoom level of7.
Raster size, specified as one of these options.
A positive integer,
m, wheremis the number of rows and columns in the output image.A two-element vector of positive integers,
[m n], wheremis the number of rows andnis the number of columns in the output image.
Each element must be in the range [64, 2048].
Output Arguments
Tips
When displaying a figure that contains a basemap, ensure that the attribution is visible. If the attribution is not readable, then display the attribution somewhere else on the figure, such as in the title.
If you do not know the basemap, latitude-longitude limits, map center, or zoom level you want, you can open and explore a geographic axes by using the
geoaxesfunction.Change the basemap by using the
geobasemapfunction.Get the latitude-longitude limits by using the
geolimitsfunction.Get the map center by querying the
MapCenterproperty of the axes.gx = geoaxes; gx.MapCenter
Get the zoom level by querying the
ZoomLevelproperty of the axes.gx = geoaxes; gx.ZoomLevel
Version History
Introduced in R2022a