wmmarker
(To be removed) Display geographic marker on web map
The wmmarker function will be removed in a future release. Use a
geographic axes object and the geoiconchart
function instead. For information on updating your code, see Version History.
Description
wmmarker( displays a marker overlay based on
the vector geographic features stored in P)P. Each element of
P defines one marker overlay.
wmmarker( displays the
overlay in the web map specified by the web map handle, wm,___)wm.
wmmarker(__, specifies name-value
pairs that set additional display properties. Parameter names can be abbreviated and are
case-insensitive.Name,Value)
h = wmmarker(___)
Examples
Display a marker on a web map.
wmmarker(51.519,-0.13)
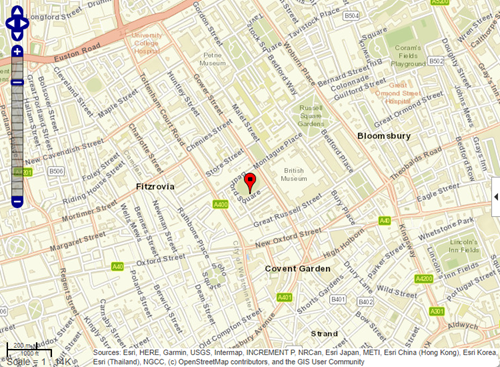
The function adds the marker name to the list of overlays in the Layer Manager. The default name is Marker Overlay 1.
Input Arguments
Name-Value Arguments
Specify optional pairs of arguments as
Name1=Value1,...,NameN=ValueN, where Name is
the argument name and Value is the corresponding value.
Name-value arguments must appear after other arguments, but the order of the
pairs does not matter.
Before R2021a, use commas to separate each name and value, and enclose
Name in quotes.
Example: wmmarker(lat,lon,'Autofit',true)
Overlay visibility, specified as the comma-separated pair consisting of
'Autofit' and the logical flag true or
false, or the numeric value 1 or 0. If true or
1, wmmarker adjusts the spatial extent of the map to ensure that
all the vector overlays on the map are visible. If false,
wmmarker does not adjust the spatial extent when the overlay is
added to the map.
Overlay visibility, specified as a scalar logical or numeric value
true (1) or false
(0).
If
true,wmmarkeradjusts the spatial extent of the map to ensure that all the vector overlays on the map are visible.If
false,wmmarkerdoes not adjust the spatial extent when the overlay is added to the map.
Data Types: double | logical
Description of feature, specified as the comma-separated pair consisting of
'Description' and a character vector, cell array of character
vectors, or scalar structure. The description defines the content that
wmmarker displays in the feature’s description balloon which
appears when a user clicks on the feature in the web map. Description elements can be
either plain text or HTML markup. When you specify an attribute spec, the display in
the balloon for the attribute fields of P are modified according
to the specification. The default value is an empty character vector
(''). If the value is a structure, the attribute spec is applied
to the attributes of each feature of P and ignored with
lat and lon input.
If the value is a cell array it is either scalar or the same length as
P, orlatandlon, and specifies the description for each marker.If the value is a structure, the attribute spec is applied to the attributes of each feature of
Pand ignored withlatandloninput.
Data Types: char | struct | cell
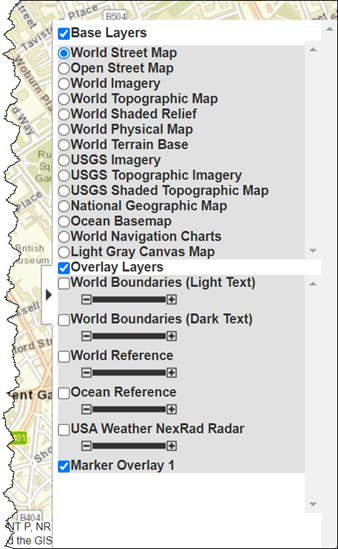
Name of overlay layer, specified as the comma-separated pair consisting of
'OverlayName' and a character vector. wmmarker
inserts the name in the Layer Manager under the Overlays item. The Layer Manager is
the tool that appears on the right side of the web map frame. The default name is
'Marker Overlay where
N'N is the number assigned to this overlay.
Data Types: char
Name of feature, specified as the comma-separated pair consisting of
'FeatureName' and a character vector or cell array of character
vectors. The name appears in the feature's balloon when a user clicks on the feature
in the web map. The default value is ', where
OverlayName
: Point K'OverlayName is the name of the overlay and
K is the number assigned to a particular point. If the
value is a character vector, wmmarker applies it to all features.
If the value is a cell array, it must be a scalar or an array with the same length as
P or lat and
lon.
Data Types: char | cell
File name of custom icon for a marker, specified as the comma-separated pair
consisting of 'Icon' and a character vector or cell array of
character vectors. If the icon file name is not in the current folder, or in a folder
on the MATLAB® path, specify a full or relative path name. If you specify an Internet
URL it must include the protocol type. If the icon file name is not specified, the
default icon is displayed. For best results when you want to view a non-default icon,
specify a PNG file containing image data with an alpha mask.
Data Types: char | cell
Scaling factor for icon, specified as the comma-separated pair consisting of
'IconScale' and a positive numeric scalar or vector.
Data Types: double
Icon color, specified as the comma-separated pair consisting of
'Color' and one of these options.
A color name such as
'red'or a short name such as'r'.An RGB triplet, which is a three-element row vector whose elements specify the intensities of the red, green, and blue components of the color. The intensities must be in the range
[0,1]; for example,[0.4 0.6 0.7].A cell array of color names such as
{'red','green','blue'}or{'r','g','b'}.A string vector of color names such as
["red" "green" "blue"]or["r" "g" "b"].A matrix of RGB triplets, which is a three-column matrix in which each row is an RGB triplet.
The way you specify the color depends on the desired color scheme.
To apply the same color to all icons, specify a single color name or RGB triplet.
To apply a different color to each icon, specify a cell array of color names, a string vector of color names, or a matrix of RGB triplets. The number of colors and RGB triplets must match the length of
latandlonorP.
If you specify a custom icon file, then the wmmarker function
ignores this argument.
This table contains the color names and equivalent RGB triplets for some common colors.
| Color Name | Short Name | RGB Triplet | Appearance |
|---|---|---|---|
"red" | "r" | [1 0 0] |
|
"green" | "g" | [0 1 0] |
|
"blue" | "b" | [0 0 1] |
|
"cyan"
| "c" | [0 1 1] |
|
"magenta" | "m" | [1 0 1] |
|
"yellow" | "y" | [1 1 0] |
|
"black" | "k" | [0 0 0] |
|
"white" | "w" | [1 1 1] |
|
Data Types: char | string | cell | double
Transparency of marker, specified as the comma-separated pair consisting of
'Alpha' and a numeric scalar or vector. If you specify a vector,
it must include a value for each marker, that is, the vector must be the same length
as P. The default value, 1, means that the
marker is fully opaque.
Data Types: single | double | int8 | int16 | int32 | int64 | uint8 | uint16 | uint32 | uint64
Output Arguments
Version History
Introduced in R2013bSee Also
1 Alignment of boundaries and region labels are a presentation of the feature provided by the data vendors and do not imply endorsement by MathWorks®.