Plotting in Polar Coordinates
These examples show how to create line plots, scatter plots, and histograms in polar coordinates. They also show how to annotate and change axes limits on polar plots.
Create Polar Line Plot
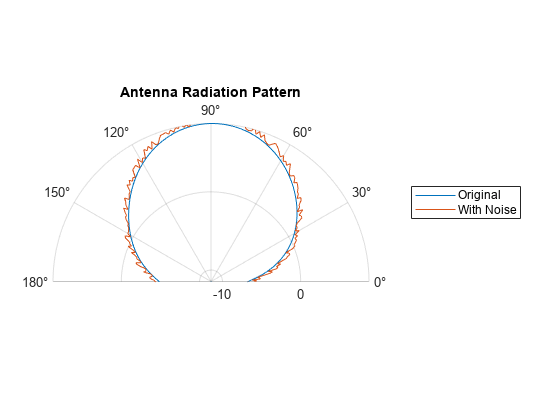
Visualize the radiation pattern from an antenna in polar coordinates. Load the file antennaData.mat, which contains the variables theta and rho. The variable rho is a measure of how intensely the antenna radiates for each value of theta. Visualize this radiation pattern by plotting the data in polar coordinates using the polarplot function.
load('antennaData.mat')

figure
polarplot(theta,rho)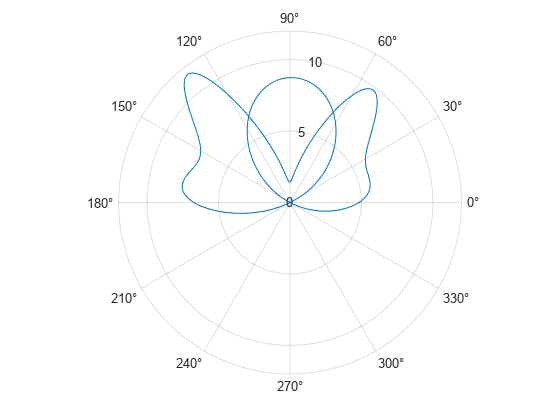
Before R2022a, polar axes do not include degree symbols by default. To add them, get the polar axes using pax = gca. Then modify the tick labels using pax.ThetaTickLabel = string(pax.ThetaTickLabel) + char(176).
Multiple Polar Line Plots
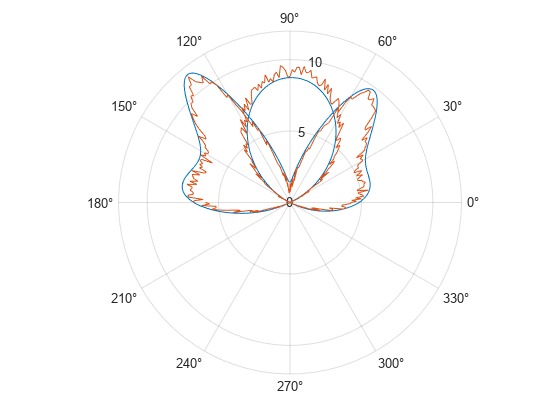
Use hold on to retain the current polar axes and plot additional data using polarplot.
rng('default')
noisy = rho + rand(size(rho));
hold on
polarplot(theta,noisy)
hold off
Annotating Polar Plots
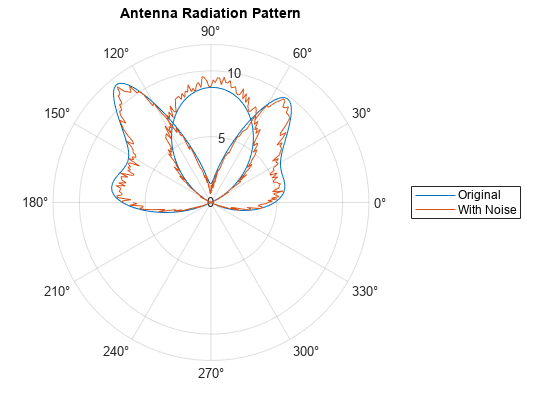
Use annotation functions such as legend and title to label polar plots like other visualization types.
legend('Original','With Noise')
title('Antenna Radiation Pattern')
Change Polar Axes Limits
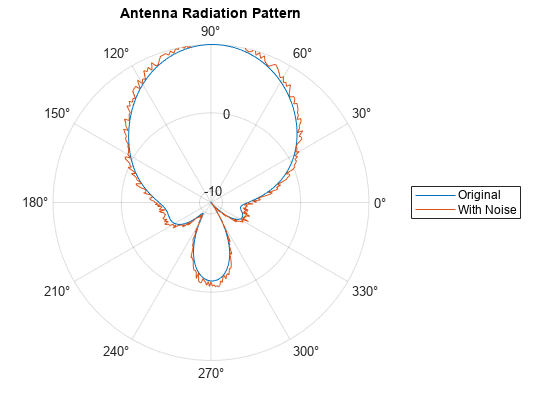
By default, negative values of the radius are plotted as positive values in the polar plot. Use rlim to adjust the r-axis limit to include negative values.
rmin = min(rho);
rmax = max(rho);
rlim([rmin rmax])
Change the theta-axis limits to 0 and 180 with thetalim.
thetalim([0 180])
Create Polar Scatter Plot
Plot wind velocity data in polar coordinates. Load the file windData.mat, which includes the variables direction, speed, humidity, and C. Visualize the wind patterns by plotting the data in polar coordinates using the polarscatter function.
load('windData.mat')
polarscatter(direction,speed)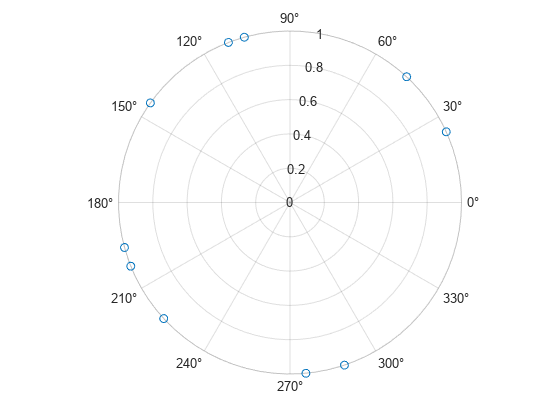
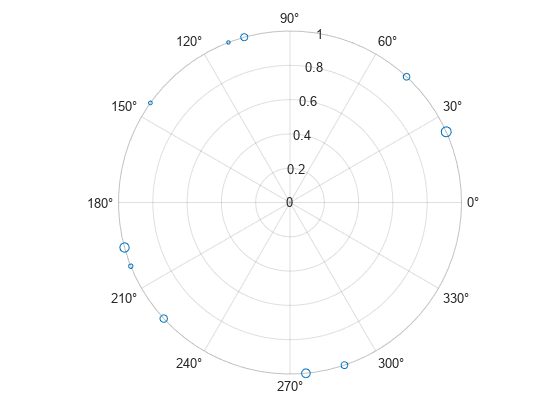
Include a third data input to vary marker size and represent a third dimension.
polarscatter(direction,speed,humidity)
Use formatting inputs to adjust marker display properties.
polarscatter(direction,speed,humidity,C,'filled')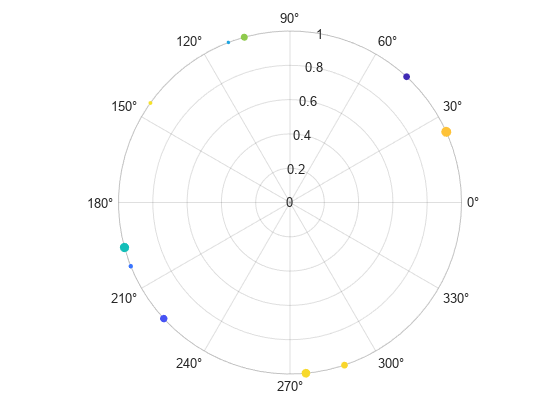
Create Polar Histogram Plot
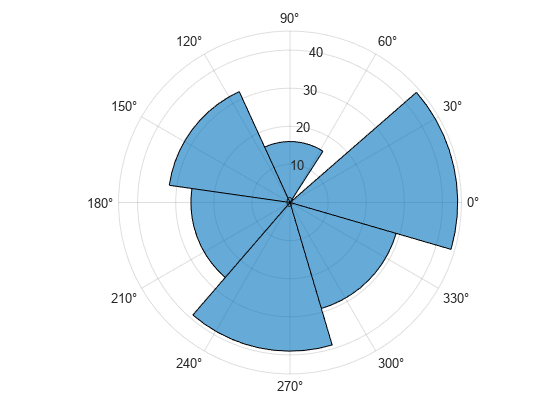
Visualize the data using the polarhistogram function, which produces a visual representation known as a wind rose.
polarhistogram(direction)
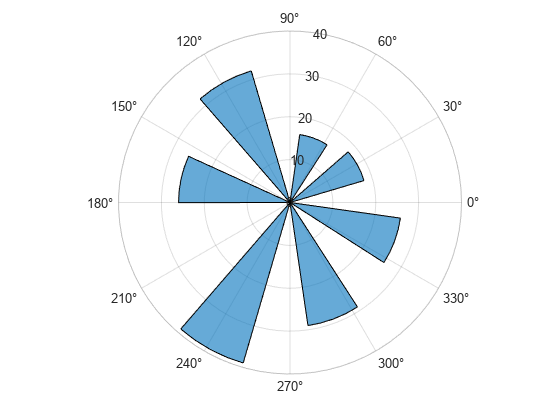
Specify a bin determination algorithm. The polarhistogram function has a variety of bin number and bin width determination algorithms to choose from within the BinMethod field.
polarhistogram(direction,'BinMethod','sqrt')
Specify the number of bins and the bin width.
polarhistogram(direction,24,'BinWidth',.5)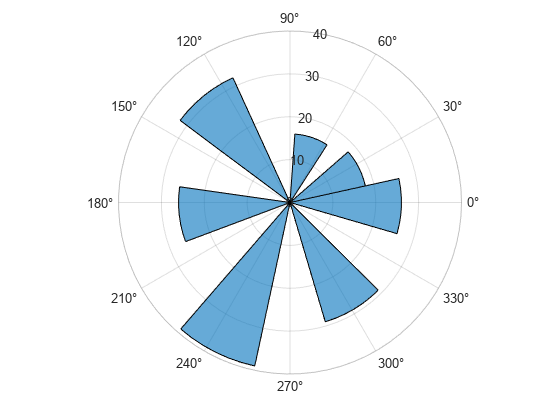
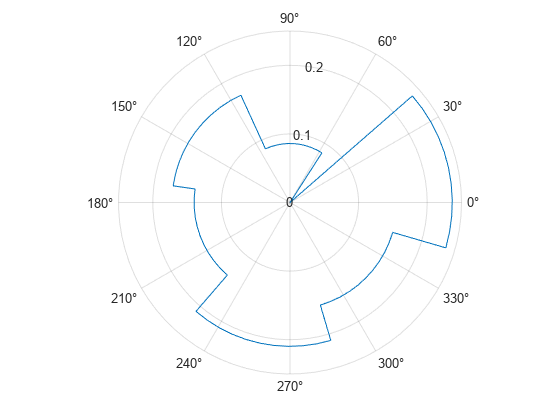
Specify a normalization method and adjust the display style to exclude any fill.
polarhistogram(direction,'Normalization','pdf','DisplayStyle','stairs')
See Also
polarplot | thetaticks | rticks | rticklabels | thetaticklabels | PolarAxes Properties