Contenuto principale

plot

R2026b

Plot alpha shape

Description

plot(shp) plots alpha shape shp in a figure window.

example

plot(shp,Name=Value) uses additional options specified by one or more name-value arguments. For a complete list of allowed Name=Value pairs, see Patch Properties.

example

h = plot(___) returns a handle to a Patch object using any of the previous syntaxes.

Examples

collapse all

Create a set of 3-D points.

[x1,y1,z1] = sphere(24);
x1 = x1(:);
y1 = y1(:);
z1 = z1(:);
x2 = x1 + 5;
P = [x1 y1 z1; x2 y1 z1];
P = unique(P,"rows");

Create and plot an alpha shape using an alpha radius of 1.5.

shp = alphaShape(P,1.5);
plot(shp)
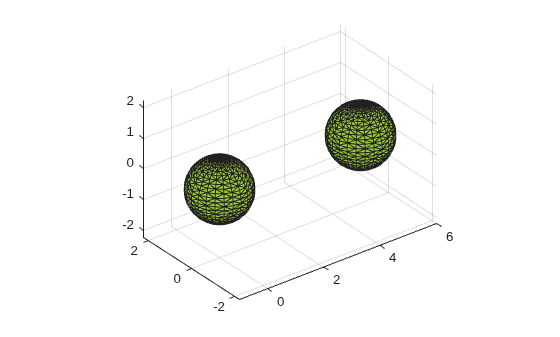
3-D alpha shape showing two triangulated spheres, one centered at the origin and one offset to the right

Plot the alpha shape with a specified color and transparency factor.

plot(shp,FaceColor="red",FaceAlpha=0.1)
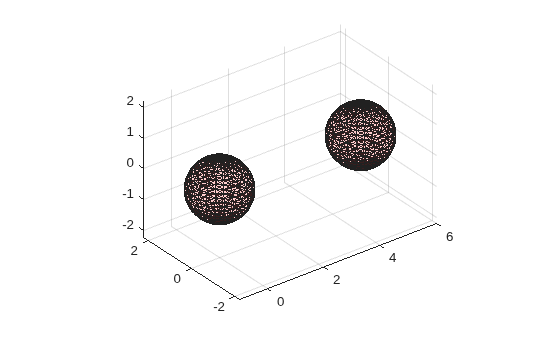
3-D alpha shape of two spheres plotted with red face color and high transparency, showing the triangulated mesh through the translucent surfaces

Input Arguments

collapse all

Alpha shape, specified as an alphaShape object. For more information, see alphaShape.

Example: shp = alphaShape(x,y) creates a 2-D alphaShape object from the (x,y) point coordinates.

Output Arguments

collapse all

Handle to Patch object, returned as a handle. For more information, see Introduction to Patch Objects.

Version History

Introduced in R2014b

See Also

|