filloutliers
Detect and replace outliers in data
Syntax
Description
B = filloutliers(A,fillmethod)A and replaces them according to
fillmethod. For example,
filloutliers(A,"previous") replaces outliers with the
previous nonoutlier element.
If
Ais a matrix, thenfilloutliersoperates on each column ofAseparately.If
Ais a multidimensional array, thenfilloutliersoperates along the first dimension ofAwhose size does not equal 1.If
Ais a table or timetable, thenfilloutliersoperates on each variable ofAseparately.
By default, an outlier is a value that is more than three scaled median absolute deviations (MAD) from the median.
You can use filloutliers functionality interactively by adding
the Clean Outlier
Data task to a live script.
B = filloutliers(A,fillmethod,findmethod)filloutliers(A,"previous","mean") defines an outlier as an
element of A more than three standard deviations from the
mean.
B = filloutliers(A,fillmethod,"percentiles",threshold)threshold. The threshold argument is a
two-element row vector containing the lower and upper percentile thresholds, such as
[10 90].
B = filloutliers(A,fillmethod,movmethod,window)window. For example,
filloutliers(A,"previous","movmean",5) identifies outliers as
elements more than three local standard deviations from the local mean within a
five-element window.
B = filloutliers(___,Name=Value)filloutliers(A,"previous",SamplePoints=t) detects outliers in
A relative to the corresponding elements of a time vector
t.
Examples
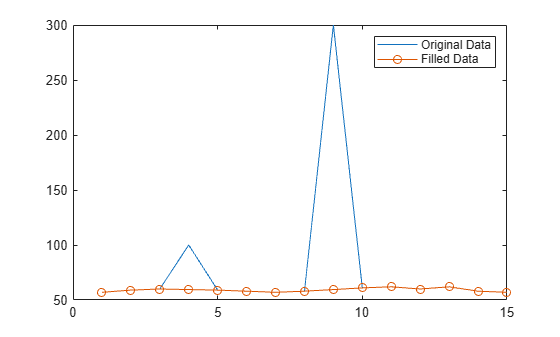
Fill outliers in a vector of data using the "linear" method, and visualize the filled data.
Create a vector of data containing two outliers.
A = [57 59 60 100 59 58 57 58 300 61 62 60 62 58 57];
Replace the outliers using linear interpolation.
B = filloutliers(A,"linear");Plot the original data and the data with the outliers filled.
plot(A)
hold on
plot(B,"o-")
legend("Original Data","Filled Data")
Identify potential outliers in a table of data, fill any outliers using the "nearest" fill method, and visualize the cleaned data.
Create a timetable of data, and visualize the data to detect potential outliers.
T = hours(1:15);
V = [57 59 60 100 59 58 57 58 300 61 62 60 62 58 57];
A = timetable(T',V');
plot(A.Time,A.Var1)
Fill outliers in the data, where an outlier is defined as a point more than three standard deviations from the mean. Replace the outlier with the nearest element that is not an outlier.
B = filloutliers(A,"nearest","mean")
B=15×1 timetable
    Time     Var1
    _____    ____

    1 hr      57
    2 hr      59
    3 hr      60
    4 hr     100
    5 hr      59
    6 hr      58
    7 hr      57
    8 hr      58
    9 hr      61
    10 hr     61
    11 hr     62
    12 hr     60
    13 hr     62
    14 hr     58
    15 hr     57
In the same graph, plot the original data and the data with the outlier filled.
hold on
plot(B.Time,B.Var1,"o-")
legend("Original Data","Filled Data")

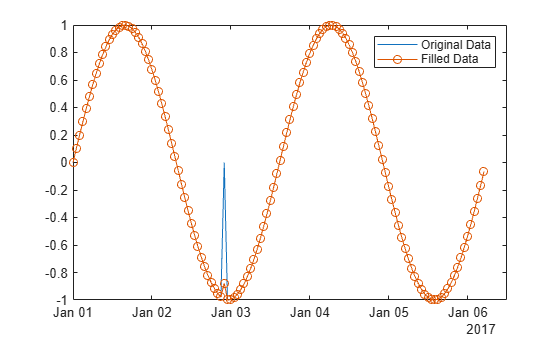
Use a moving median to detect and fill local outliers within a sine wave that corresponds to a time vector.
Create a vector of data containing a local outlier.
x = -2*pi:0.1:2*pi;
A = sin(x);
A(47) = 0;
Create a time vector that corresponds to the data in A.
t = datetime(2017,1,1,0,0,0) + hours(0:length(x)-1);
Define outliers as points more than three local scaled MAD from the local median within a sliding window. Find the location of the outlier in A relative to the points in t with a window size of 5 hours. Fill the outlier with the computed threshold value using the method "clip".
[B,TF,L,U,C] = filloutliers(A,"clip","movmedian",hours(5),SamplePoints=t);
Plot the original data and the data with the outlier filled.
plot(t,A)
hold on
plot(t,B,"o-")
legend("Original Data","Filled Data")
Create a matrix of data containing outliers along the diagonal.
A = randn(5,5) + diag(1000*ones(1,5))
A = 5×5
103 ×

    1.0005   -0.0013   -0.0013   -0.0002    0.0007
    0.0018    0.9996    0.0030   -0.0001   -0.0012
   -0.0023    0.0003    1.0007    0.0015    0.0007
    0.0009    0.0036   -0.0001    1.0014    0.0016
    0.0003    0.0028    0.0007    0.0014    1.0005
Fill outliers with zeros based on the data in each row, and display the new values.
[B,TF] = filloutliers(A,0,2);
B
B = 5×5

         0   -1.3077   -1.3499   -0.2050    0.6715
    1.8339         0    3.0349   -0.1241   -1.2075
   -2.2588    0.3426         0    1.4897    0.7172
    0.8622    3.5784   -0.0631         0    1.6302
    0.3188    2.7694    0.7147    1.4172         0
You can access the detected outlier values and their filled values using TF as an index vector.
[A(TF) B(TF)]
ans = 5×2
103 ×

    1.0005         0
    0.9996         0
    1.0007         0
    1.0014         0
    1.0005         0
Create a vector containing two outliers and detect their locations.
A = [57 59 60 100 59 58 57 58 300 61 62 60 62 58 57];
detect = isoutlier(A)
detect = 1×15 logical array

   0   0   0   1   0   0   0   0   1   0   0   0   0   0   0
Fill the outliers using the "nearest" method. Instead of using a detection method, provide the outlier locations detected by isoutlier.
B = filloutliers(A,"nearest",OutlierLocations=detect)B = 1×15
57 59 60 59 59 58 57 58 61 61 62 60 62 58 57
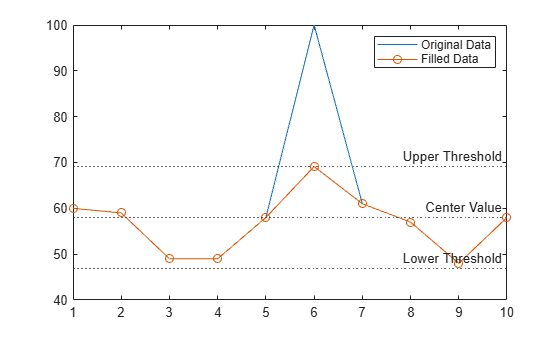
Replace the outlier in a vector of data using the "clip" fill method.
Create a vector of data with an outlier.
A = [60 59 49 49 58 100 61 57 48 58];
Detect outliers with the default method "median", and replace the outlier with the upper threshold value by using the "clip" fill method.
[B,TF,L,U,C] = filloutliers(A,"clip");Plot the original data, the data with the outlier filled, and the thresholds and center value determined by the outlier detection method. The center value is the median of the data, and the upper and lower thresholds are three scaled MAD above and below the median.
plot(A)
hold on
plot(B,"o-")
yline([L U C],":",["Lower Threshold","Upper Threshold","Center Value"])
legend("Original Data","Filled Data")
Since R2024a
Create a table and fill outliers defined as values greater than 10. Create a table of logical variables loc that indicates the locations of outliers to fill. Then, specify the known outlier locations for filloutliers using the OutlierLocations name-value argument.
A = [1; 4; 9; 12; 3];
B = [9; 0; 6; 2; 1];
C = [14; 4; 2; 3; 8];
T = table(A,B,C)
T=5×3 table
    A     B    C
    __    _    __

     1    9    14
     4    0     4
     9    6     2
    12    2     3
     3    1     8
loc = T>10
loc=5×3 table
      A        B        C
    _____    _____    _____

    false    false    true
    false    false    false
    false    false    false
    true     false    false
    false    false    false
T = filloutliers(T,10,OutlierLocations=loc)
T=5×3 table
    A     B    C
    __    _    __

     1    9    10
     4    0     4
     9    6     2
    10    2     3
     3    1     8
Input Arguments
Input data, specified as a vector, matrix, multidimensional array, or a table or timetable with numeric variables.
If
Ais a table, then its variables must be of typedoubleorsingle, or you can use theDataVariablesargument to listdoubleorsinglevariables explicitly. Specifying variables is useful when you are working with a table that contains variables with data types other thandoubleorsingle.If
Ais a timetable, thenfilloutliersoperates only on the table elements. If row times are used as sample points, then they must be unique and listed in ascending order.
Data Types: double | single | table | timetable
Fill method for replacing outliers, specified as one of these values.
| Fill Method | Description |
|---|---|
| Numeric scalar | Specified scalar value |
"center" | Center value determined by
findmethod |
"clip" | Lower threshold value for elements smaller than the
lower threshold determined by
findmethod; upper threshold value
for elements larger than the upper threshold determined
by findmethod |
"previous" | Previous nonoutlier value |
"next" | Next nonoutlier value |
"nearest" | Nearest nonoutlier value |
"linear" | Linear interpolation of neighboring, nonoutlier values |
"spline" | Piecewise cubic spline interpolation |
"pchip" | Shape-preserving piecewise cubic spline interpolation |
"makima" | Modified Akima cubic Hermite interpolation (numeric,
duration, and
datetime data types only) |
Data Types: double | single | char | string
Method for detecting outliers, specified as one of these values.
| Method | Description |
|---|---|
"median" | Outliers are defined as elements more than three
scaled MAD from the median. The scaled MAD is defined as
c*median(abs(A-median(A))), where
c=-1/(sqrt(2)*erfcinv(3/2)). |
"mean" | Outliers are defined as elements more than three
standard deviations from the mean. This method is faster
but less robust than
"median". |
"quartiles" | Outliers are defined as elements more than 1.5
interquartile ranges above the upper quartile (75
percent) or below the lower quartile (25 percent). This
method is useful when the data in A
is not normally distributed. |
"grubbs" | Outliers are detected using Grubbs’ test, which
removes one outlier per iteration based on hypothesis
testing. This method assumes that the data in
A is normally
distributed. |
"gesd" | Outliers are detected using the generalized extreme
Studentized deviate test for outliers. This iterative
method is similar to "grubbs" but can
perform better when multiple outliers are masking each
other. The maximum outlier count specified by
MaxNumOutliers depends on the
number of elements in A. |
Percentile thresholds, specified as a two-element row vector whose
elements are in the interval [0,100]. The first element indicates the lower
percentile threshold, and the second element indicates the upper percentile
threshold. The first element of threshold must be less
than the second element.
For example, a threshold of [10 90] defines outliers as
points below the 10th percentile and above the 90th percentile.
Moving method for detecting outliers, specified as one of these values.
| Method | Description |
|---|---|
"movmedian" | Outliers are defined as elements more than three
local scaled MAD from the local median over a window
length specified by window. This
method is also known as a Hampel
filter. |
"movmean" | Outliers are defined as elements more than three
local standard deviations from the local mean over a
window length specified by
window. |
Window length for moving method, specified as a positive integer scalar, a two-element vector of positive integers, a positive duration scalar, or a two-element vector of positive durations.
When window is a positive integer scalar, the window is
centered about the current element and contains window-1
neighboring elements. If window is even, then the window
is centered about the current and previous elements.
When window is a two-element vector of positive
integers [b f], the window contains the current element,
b elements backward, and f
elements forward.
When A is a timetable or
SamplePoints is specified as a
datetime or duration vector,
window must be of type duration,
and the windows are computed relative to the sample points.
For more information about the window position, see Moving Window Size.
Array dimension to operate along, specified as a positive integer scalar. If no value is specified, then the default is the first array dimension whose size does not equal 1.
Consider an m-by-n input matrix,
A:
filloutliers(A,fillmethod,1)fills outliers according to the data in each column ofAand returns anm-by-nmatrix.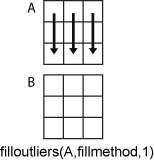
filloutliers(A,fillmethod,2)fills outliers according to the data in each row ofAand returns anm-by-nmatrix.
For table or timetable input data, dim is not supported
and operation is along each table or timetable variable separately.
Name-Value Arguments
Output Arguments
More About
This table illustrates the window position across the default
uniformly spaced sample points vector [1 2 3 4 5 6 7].
Description | Window Size and Location | Sample Points in Window | Diagram |
|---|---|---|---|
For a scalar window size, the leading edge of the window is excluded and the trailing edge of the window is included. |
Current sample point = 4 | 3, 4, 5 |
|
Current sample point = 4 | 2, 3, 4, 5 |
| |
For a vector window size, the leading edge and the trailing edge are included. |
Current sample point = 4 | 2, 3, 4, 5, 6 |
|
For sample points near the endpoints of the input data,
|
Current sample point = 2 | 1, 2, 3, 4 |
|


![Given elements 1 to 7, if the current sample point is 4, then the corresponding window spans the range [2, 6].](movwindow_vector.png)
![Given elements 1 to 7, if the current sample point is 2, then the corresponding window spans the range [1, 4].](movwindow_edgetruncate.png)
Alternative Functionality
Live Editor Task
You can use filloutliers functionality interactively by adding
the Clean Outlier
Data task to a live script.

References
[1] NIST/SEMATECH e-Handbook of Statistical Methods, https://www.itl.nist.gov/div898/handbook/, 2013.
Extended Capabilities
Version History
Introduced in R2017aSee Also
Functions
rmoutliers|isoutlier|clip|islocalmin|islocalmax|smoothdata|ismissing|fillmissing|fillmissing2