legend
Add legend to axes
Syntax
Description
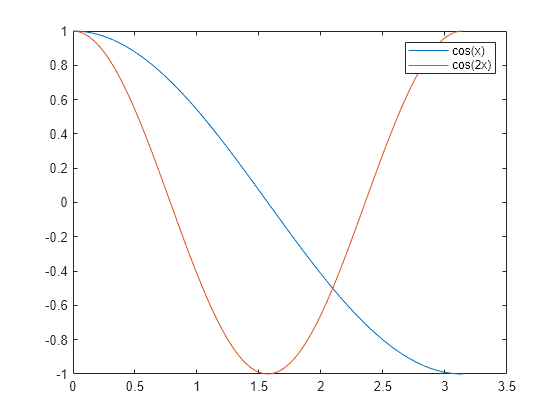
legend creates a legend with descriptive labels for each
plotted data series. For the labels, the legend uses the text from the
DisplayName properties of the data series. If the
DisplayName property is empty, then the legend uses a
label of the form 'dataN'. The legend automatically updates
when you add or delete data series from the axes. This command creates a legend
in the current axes, which is returned by the gca command. If
the current axes is empty, then the legend is empty. If no axes exist, then
legend creates a Cartesian axes.
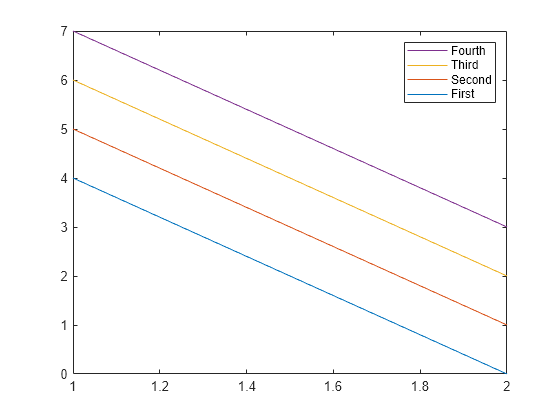
legend( sets the
legend labels. Specify the labels as a list of character vectors or strings,
such as label1,...,labelN)legend('Jan','Feb','Mar').
legend( sets the labels using
a cell array of character vectors, a string array, or a character matrix, such
as labels)legend({'Jan','Feb','Mar'}).
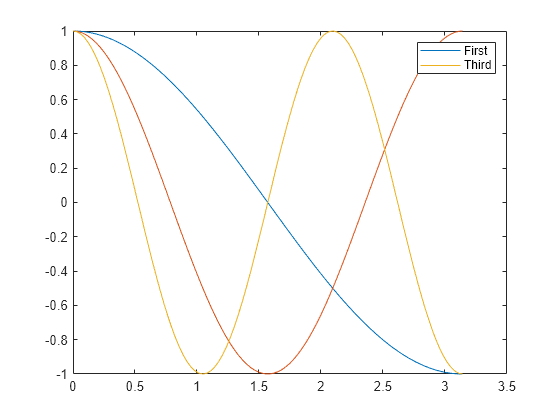
legend( only
includes items in the legend for the data series listed in
subset,___)subset. Specify subset as a vector of
graphics objects. You can specify subset before specifying
the labels or with no other input arguments.
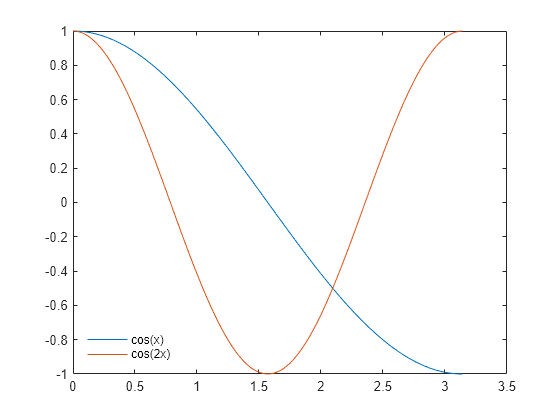
legend(___,'Location',
sets the legend location. For example, lcn)'Location','northeast'
positions the legend in the upper right corner of the axes. Specify the location
after other input arguments.
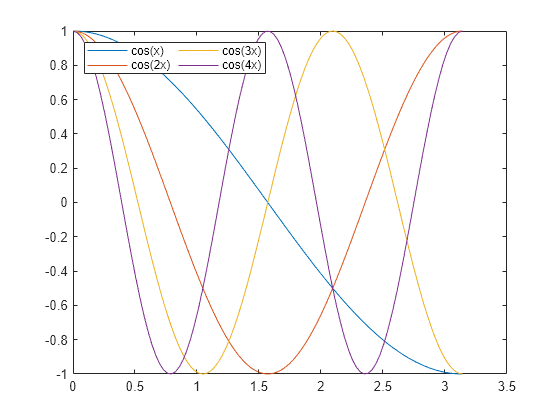
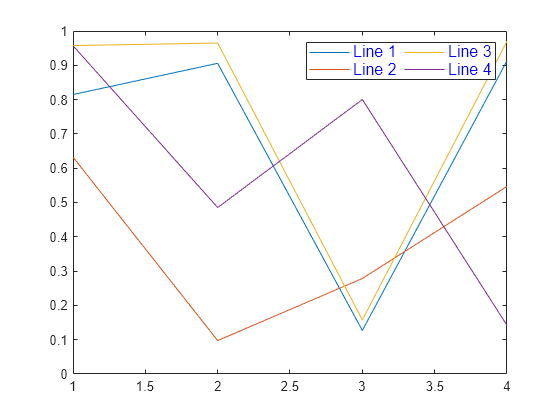
legend(___,'Orientation',,
where ornt)ornt is 'horizontal', displays the
legend items side-by-side. The default for ornt is
'vertical', which stacks the items vertically.
legend(___,
sets legend properties using one or more name-value pair arguments.Name,Value)
legend(, where
bkgd)bkgd is 'boxoff', removes the legend
background and outline. The default for bkgd is
'boxon', which displays the legend background and
outline.
lgd = legend(___)Legend object. Use
lgd to query and set properties of the legend after it is
created. For a list of properties, see Legend Properties.
legend( controls the visibility
of the legend, where vsbl)vsbl is 'hide',
'show', or 'toggle'.
legend('off') deletes the legend.
Examples
Input Arguments
Name-Value Arguments
Output Arguments
Tips
To label more than 50 objects in the legend, specify a label for each object. Otherwise,
legenddepicts only the first 50 objects in the graph.
Algorithms
Recalling the
legendfunction does not reset legend properties, such as the location or orientation. If a legend exists, then thelegendfunction updates the existing legend. AnAxesobject can have only one legend.The legend reflects the visibility of graphics objects in the axes. Graphics objects that have a
Visibleproperty set to'off'appear as grayed out items in the legend.


