uilamp
Create lamp component
Description
lmp = uilampLamp object.
MATLAB® calls the uifigure function to create
the figure.
lmp = uilamp(___,Name,Value)Lamp properties using one or more
name-value arguments. For example, uilamp(Color="red")
creates a red lamp. For a list of all properties, see Lamp. Use this option with any
of the input argument combinations in the previous syntaxes.
Examples
Create a lamp in a UI figure.
fig = uifigure;
lmp = uilamp(fig);
Create a red lamp in a UI figure.
fig = uifigure;
lmp = uilamp(fig,Color="red");
Query the Color property to return the lamp color as an RGB triplet.
c = lmp.Color
c = 1×3

     1     0     0
Update the color by setting the Color property.
lmp.Color = "#EDB120";
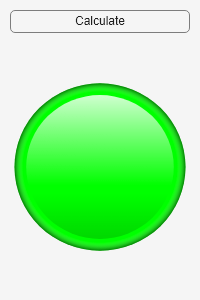
Create an app that changes the color of a lamp while a long computation runs.
In a file named lampApp.m, write a function that implements the app:
Create a UI figure and a grid layout manager to lay out the app.
Create a button and a lamp in the grid layout manager.
Write a callback function named
calcthat performs a long calculation and changes the lamp color to red while the calculation runs. Call thedrawnowfunction after updating the lamp color to see the updates on the screen.To run the
calcbutton when the app user clicks, the button, assign the function to theButtonPushedFcncallback property of the button. For more information about callback functions, see Create Callbacks for Apps Created Programmatically.
function lampApp
fig = uifigure(Position=[100 100 200 300]);
g = uigridlayout(fig,[2,1]);
g.RowHeight = {'fit','1x'};
btn = uibutton(g,Text="Calculate");
lmp = uilamp(g,Color="green");
btn.ButtonPushedFcn=@(src,event) calc(lmp);
end

function calc(lamp)
lamp.Color = "red";
drawnow
svd(rand(4000));
lamp.Color = "green";
drawnow
end
Run the app. Click the Calculate button to perform the calculation with the lamp indicator.
lampApp
Input Arguments
Name-Value Arguments
Specify optional pairs of arguments as
Name1=Value1,...,NameN=ValueN, where Name is
the argument name and Value is the corresponding value.
Name-value arguments must appear after other arguments, but the order of the
pairs does not matter.
Example: uilamp(Color="red") specifies that the lamp color is
red.
Note
The properties listed here are a subset of the available properties. For
the full list, see Lamp.
Alternatively, you can specify some common colors by name. This table lists the named color options, the equivalent RGB triplets, and hexadecimal color codes.
| Color Name | Short Name | RGB Triplet | Hexadecimal Color Code | Appearance |
|---|---|---|---|---|
"red" | "r" | [1 0 0] | "#FF0000" |
|
"green" | "g" | [0 1 0] | "#00FF00" |
|
"blue" | "b" | [0 0 1] | "#0000FF" |
|
"cyan"
| "c" | [0 1 1] | "#00FFFF" |
|
"magenta" | "m" | [1 0 1] | "#FF00FF" |
|
"yellow" | "y" | [1 1 0] | "#FFFF00" |
|
"black" | "k" | [0 0 0] | "#000000" |
|
"white" | "w" | [1 1 1] | "#FFFFFF" |
|
This table lists the default color palettes for plots in the light and dark themes.
| Palette | Palette Colors |
|---|---|
Before R2025a: Most plots use these colors by default. |
|
|
|
You can get the RGB triplets and hexadecimal color codes for these palettes using the orderedcolors and rgb2hex functions. For example, get the RGB triplets for the "gem" palette and convert them to hexadecimal color codes.
RGB = orderedcolors("gem");
H = rgb2hex(RGB);
Before R2023b: Get the RGB triplets using RGB =
get(groot,"FactoryAxesColorOrder").
Before R2024a: Get the hexadecimal color codes using H =
compose("#%02X%02X%02X",round(RGB*255)).
Data Types: double | char