Main Content

setup

Set up the mobile robot state propagator

Since R2021b

Description

setup(mobileProp) sets up the mobileRobotPropagator object based on the properties of the object. If you change the properties of the object, use this object function before you use the object to sample controls, propagate the system, or calculate distances.

Note

Override this function to implement custom functionality to run in the setup.

example

Examples

collapse all

Create a state propagator and specify the distance metric for estimating propagation cost.

propagator = mobileRobotPropagator(DistanceEstimator="dubins");

Create a Dubins state space.

dubinsSpace = stateSpaceDubins([0 25; 0 25; -pi pi]);

Update the state space of the state propagator using the created state space.

propagator.StateSpace = dubinsSpace;
setup(propagator)

Create a navPath object based on multiple waypoints in a Dubins space.

path = navPath(dubinsSpace);
waypoints = [8 10 pi/2;
             7 14 pi/4;
             10 17 pi/2;
             10 10 -pi];
append(path,waypoints)

Interpolate that path so that it contains exactly 250 points.

numStates = 250;
interpolate(path,numStates)

Extract the sequence of motions from the path.

q1 = path.States(1:end-1,:); % Initial states
q2 = path.States(2:end,:);   % Final states

Estimate the cost of propagating to target state.

cost = distance(propagator,q1,q2);

Generate a series of control commands and number of steps to move from the current state q1 with control command u toward the target state q2.

u = zeros(size(q1,1),propagator.NumControlOutput);
steps = zeros(size(q1,1),1);
for i = 1:size(q1,1)
    [u(i+1,:),steps(i)] = sampleControl(propagator,q1(i,:),u(i,:),q2(i,:));
end

Create a control-based path object with the specified state propagator and a sequence of specified states, controls, targets, and durations.

states = path.States;
controls = u(2:end,:);
targets = q2;
durations = steps*propagator.ControlStepSize;
path2 = navPathControl(propagator,states,controls,targets,durations);

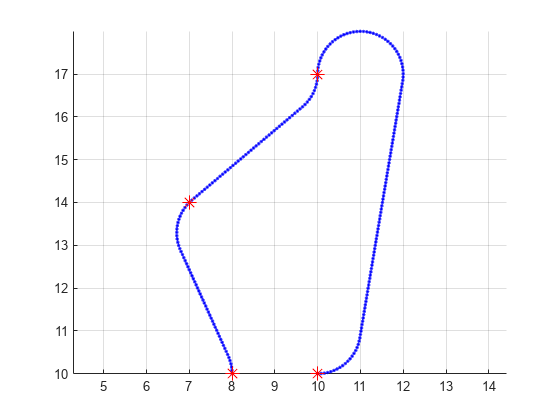
Visualize the results.

figure
grid on
axis equal
hold on
plot(path2.States(:,1),path2.States(:,2),".b")
plot(waypoints(:,1),waypoints(:,2),"*r","MarkerSize",10)

Figure contains an axes object. The axes object contains 2 objects of type line. One or more of the lines displays its values using only markers

Input Arguments

collapse all

Mobile robot state propagator, specified as a mobileRobotPropagator object.

Version History

Introduced in R2021b