Radar link budget and detectability.
A radar link budget is used to find the received radar signal
level based on the transmitted signal level, taking into account all the losses and gains
found along the signal path. Together with the noise level measurements, you can use the
link budget to calculate the received signal to noise ratio. The
radarbudgetplot function illustrates the components of the link budget
and lets you visualize the radar detectability factor . The radar
detectability factor is the minimum SNR required to make a detection with specified
probabilities of detection, Pd, and false alarm,
Pfa. A waterfall chart shows the contributions
of the individual losses and gains present in the radar system to the total power required
by the radar to produce a detection.
Once the radar detectability factor is computed, you can use the radar equation to
determine the range at which the available SNR for a given target is equal to the radar
detectability factor. At ranges where the available SNR exceeds the detectability factor,
the radar can make detections with the specified
Pd and
Pfa. At the ranges where the available SNR is
lower than the detectability factor, the radar cannot achieve the required
Pd and
Pfa.
The actual SNR tells you if the combined gains and losses are sufficient to exceed the
required SNR. to declare a detection. For example the required SNR to detect a Swerling 1
target is substantially higher than for a Swerling 0
target.
D0
= 13.1
D1
= 21.1
A Swerling 0 target has a constant RCS while a Swerling 1 target has a fluctuating RCS.
The requirement to maintain a certain Pd and
Pfa for a fluctuating target requires a larger
SNR to ensure that detections are made to satisfy the
Pd level.
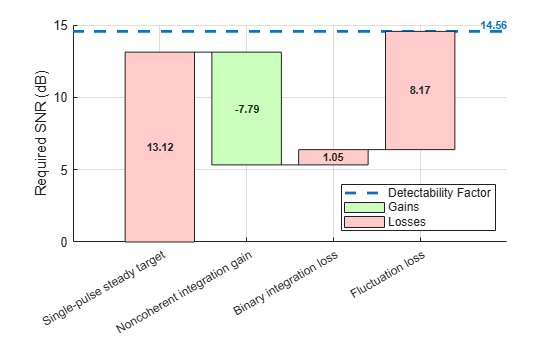
The waterfall chart represents each individual loss as a red bar with height equal to
the value of that loss in dB. Each gain is represented as a green bar with a height equal to
the value of that gain. Because losses increase the required signal power, losses are
represented as positive values on the chart. Gains decrease the required signal power and
are shown with a minus sign. The resulting detectability factor is shown as a horizontal
dashed line labeled with the corresponding detectability value and is equal to the sum of
the elements in the gl argument.