ERS SAR Raw Data Extraction and Image Formation
This example shows the steps to extract the European Remote Sensing (ERS) Synthetic Aperture Radar (SAR) system parameters, unfocused raw data and form a focused image from raw data using range migration image formation algorithm.
ERS dataset is NASA’s provision of the European Space Agency’s ERS satellites (ERS-1 and ERS-2) SAR data. As part of the Earth observation Heritage Data Program (LTDP+), the ERS missions provide scientists with historically accurate and easily accessible information to help further understand the dynamics of our planet. ERS dataset contains raw unfocused data along with system parameters file which can be used to generate focused image of the scene.
To illustrate this workflow, ERS dataset published by the NASA's Alaska Satellite Facility (ASF) [1] is used. The dataset is available for download here. Our goal is to develop a model to generate a focused image from the raw data.
Download Dataset
This example uses ERS dataset containing Committee on Earth Observation Satellites (CEOS) standard files namely: leader file (.ldr), level zero frame data file (.raw), volume descriptor file (.vol), processing information file (.pi), metadata file (.meta) and null file (.nul). The CEOS leader file contains relevant metadata information to be able to process the SAR data (.raw) it accompanies. Level zero frame data file (.raw) contains binary SAR signal data collected after processing the analog SAR signal. The volume descriptor is part of the CEOS frame distribution, containing a short summary about the processing. The processing information file provides information on the CEOS conversion describing the data set itself as well as its location on the system. The metadata file is an ASCII file that contains most of the metadata needed for using the ASF software tools. The null volume directory file is part of the CEOS frame distribution. It is used to terminate a logical data volume.
Download the dataset from the given URL using the helperDownloadERSData helper function. The size of dataset is 134 MB. ERSData.zip contains three files namely: leader file, raw file, and license file.
outputFolder = pwd;
dataURL = ['https://ssd.mathworks.com/supportfiles/radar/data/' ...
    'ERSData.zip'];
helperDownloadERSData(outputFolder,dataURL);
Downloading ERS data (134 MiB)...
Depending on your Internet connection, the download process can take some time. The code suspends MATLAB® execution until the download process is complete. Alternatively, you can download the data set to your local disk using your web browser and extract the file. If you do so, change the outputFolder variable in the code to the location of the downloaded file.
Parameter Extraction
SAR image formation involves extracting the parameters from the parameter file (E2_84699_STD_L0_F299.000.ldr) given with raw data file. The parameter file contains satellite and scene specific data which is required to form the image. Several parameters like pulse repetition frequency, wavelength, sampling rate, pulsewidth of the chirp signal, range gate delay and velocity of the sensor are extracted from the parameter file according to their specific addresses given in the description of the parameter file. Other parameters like effective velocity, minimum distance, chirp bandwidth and chirp frequency are estimated using the data extracted from the parameter file.
In this example, system parameters are extracted using the helper function ERSParameterExtractor which takes E2_84699_STD_L0_F299.000.ldr as an input file.
c = physconst('LightSpeed');                % Speed of light

% Extract ERS system parameters
[fs,fc,prf,tau,bw,v,ro,fd] = ERSParameterExtractor('E2_84699_STD_L0_F299.000.ldr');
Raw Data Extraction
Raw data is extracted from the data file (E2_84699_STD_L0_F299.000.raw) having a total of 28652 lines and 11644 bytes per line. In each line, header consists of 412 bytes and remaining 11232 bytes (5616 complex) of data for each echo. For the ERS radar, the synthetic aperture is 1296 points long. Therefore, the helper function ERSDataExtractor reads 2048 rows since it is a power of 2. Using 80% beamwidth the helper function calculates valid azimuthal points and takes overlapping patches.
In this example, unfocused raw data is extracted using the helper function which takes E2_84699_STD_L0_F299.000.raw as an input file along with system parameters.
% Extract raw data
rawData = ERSDataExtractor('E2_84699_STD_L0_F299.000.raw',fs,fc,prf,tau,v,ro,fd).';
SAR Image Formation
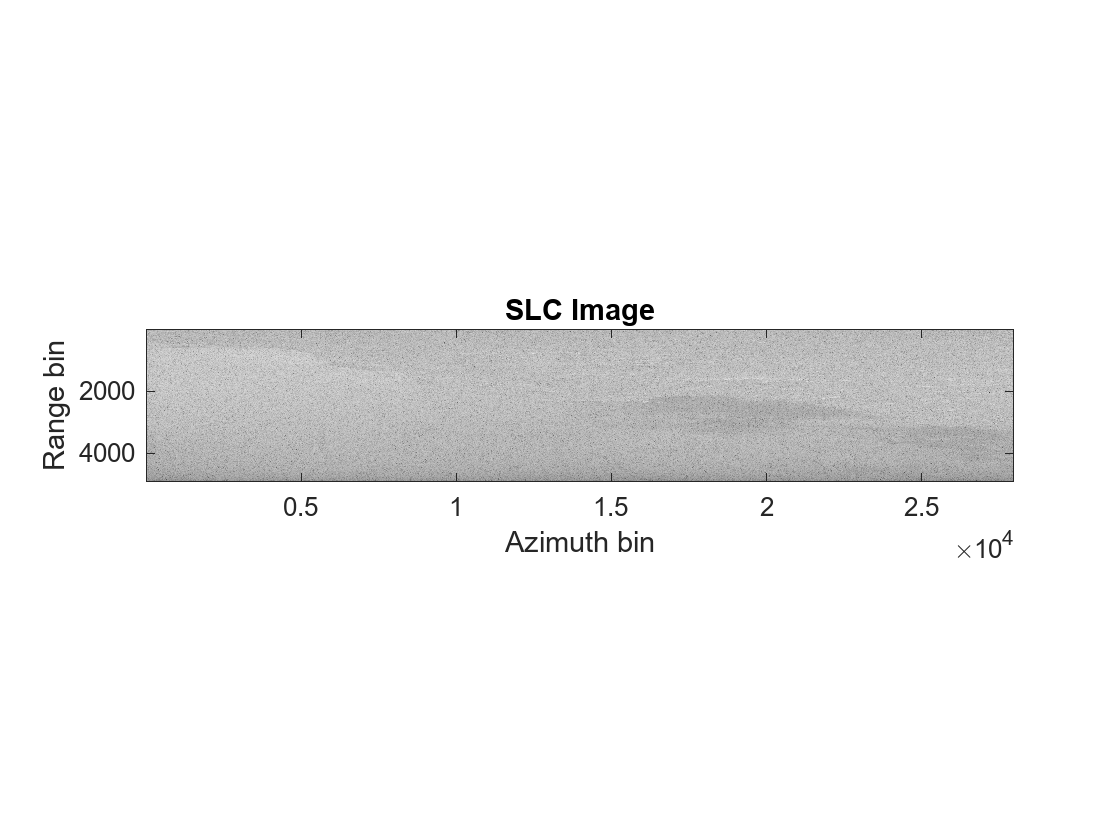
The next step is to generate single-look complex (SLC) image using the extracted system parameters and unfocused raw data. For the ERS-radar, a linear frequency modulated chirp is emitted by the radar. The phased.LinearFMWaveform System object creates a linear FM pulse waveform using the extracted system parameters. Squint angle is calculated using Doppler frequency which is close to zero for the ERS system. Range migration image formation algorithm is a frequency domain algorithm also known as wavenumber domain processing method. Use rangeMigrationLFM function to focus the raw data to SLC image.
SAR SLC image is characterized by speckle which can be modeled as a multiplicative noise, resulting in salt and pepper appearance of SAR image.
% Create LFM waveform
waveform = phased.LinearFMWaveform('SampleRate',fs,'PRF',prf,'PulseWidth',tau,'SweepBandwidth',bw,'SweepInterval','Symmetric');
sqang = asind((c*fd)/(2*fc*v));        % Squint angle

% Range migration algorithm
slcimg = rangeMigrationLFM(rawData,waveform,fc,v,ro,'SquintAngle',sqang);

% Display image
figure(1)
imagesc(log(abs(slcimg)))
axis image
colormap('gray')
title('SLC Image')
ylabel('Range bin')
xlabel('Azimuth bin')
Multi-look Processing
The effect of speckle is reduced by performing multi-look processing by making a tradeoff for image resolution. Either in range or azimuth direction or in both the directions, subsequent lines are averaged to get a better image with reduced speckle. The multi-looking can be performed either in range or azimuth or both the direction.
The helper function multilookProcessing performs averaging in range and azimuth direction with number of looks 4 and 20 respectively.
mlimg = multilookProcessing(abs(slcimg),4,20);

% Display Image
figure(2)
imagesc(log(abs(mlimg(1:end-500,:))))
axis image
colormap('gray')
title('Multi-look Image')
ylabel('Range bin')
xlabel('Azimuth bin')

Summary
This example shows how to extract the system parameters such as pulse repetition frequency, wavelength, sampling rate, pulsewidth of the chirp signal, range gate delay, velocity of the sensor and raw data. Then the range migration image formation algorithm is used to focus the raw data. Finally, the multi-look processing is applied to remove the multiplicative noise.
Helper Functions
ERSParameterExtractor
function [fs,fc,prf,tau,bw,veff,ro,fdop] = ERSParameterExtractor(file)
% Open the parameter file to extract required parameters
fid = fopen(file,'r');

% Radar wavelength (satellite specific)
status = fseek(fid,720+500,'bof');
lambda = str2double(fread(fid,[1 16],'*char'));         % Wavelength (m)

% Pulse Repetition Frequency (satellite specific)
status = fseek(fid,720+934,'bof')|status;
prf = str2double(fread(fid,[1 16],'*char'));            % PRF (Hz)

% Range sampling rate (satellite specific)
status = fseek(fid,720+710,'bof')|status;
fs =str2double(fread(fid,[1 16],'*char'))*1e+06;        % Sampling Rate (Hz)

% Range Pulse length (satellite specific)
status = fseek(fid,720+742,'bof')|status;
tau = str2double(fread(fid,[1 16],'*char'))*1e-06;      % Pulse Width (sec)

% Range Gate Delay to first range cell
status = fseek(fid,720+1766,'bof')|status;
rangeGateDelay = str2double(fread(fid,[1 16],'*char'))*1e-03;   % Range Gate Delay (sec)

% Velocity X
status = fseek(fid,720+1886+452,'bof')|status;
xVelocity = str2double(fread(fid,[1 22],'*char'));    % xVelocity (m/sec)

% Velocity Y
status = fseek(fid,720+1886+474,'bof')|status;
yVelocity = str2double(fread(fid,[1 22],'*char'));    % yVelocity (m/sec)

% Velocity Z
status = fseek(fid,720+1886+496,'bof')|status;
zVelocity = str2double(fread(fid,[1 22],'*char'));    % zVelocity (m/sec)
fclose(fid);

% Checking for any file error
if(status==1)
    fs = NaN;
    fc = NaN;
    prf = NaN;
    tau = NaN;
    bw = NaN;
    veff = NaN;
    ro = NaN;
    fdop = NaN;
    return;
end

% Values specific to ERS satellites
slope = 4.19e+11;           % Slope of the transmitted chirp (Hz/s)
h = 790000;                 % Platform altitude above ground (m)
fdop = -1.349748e+02;       % Doppler frequency (Hz)

% Additional Parameters
Re = 6378144 ;              % Earth radius (m)

% Min distance
ro = time2range(rangeGateDelay);  % Min distance (m)

% Effective velocity
v = sqrt(xVelocity^2+yVelocity^2+zVelocity^2);
veff = v*sqrt(Re/(Re+h));   % Effective velocity (m/sec)

% Chirp frequency
fc = wavelen2freq(lambda);  % Chirp frequency (Hz)

% Chirp bandwidth
bw = slope*tau;             % Chirp bandwidth (Hz)
end
ERSDataExtractor
function rawData = ERSDataExtractor(datafile,fs,fc,prf,tau,v,ro,doppler)
c = physconst('LightSpeed');                    % Speed of light

% Values specific to data file
totlines = 28652;                                % Total number of lines
numLines = 2048;                                 % Number of lines
numBytes = 11644;                                % Number of bytes of data
numHdr = 412;                                    % Header size
nValid = (numBytes-numHdr)/2 - round(tau*fs);    % Valid range samples

% Antenna length specific to ERS
L = 10;

% Calculate valid azimuth points
range = ro + (0:nValid-1) * (c/(2*fs));             % Computes range perpendicular to azimuth direction
rdc = range/sqrt(1-(c*doppler/(fc*(2*v))^2));       % Squinted range
azBeamwidth = rdc * (c/(fc*L)) * 0.8;               % Use only 80%
azTau = azBeamwidth / v;                            % Azimuth pulse length
nPtsAz = ceil(azTau(end) * prf);                    % Use the far range value
validAzPts = numLines - nPtsAz ;                    % Valid azimuth points

% Start extracting
fid = fopen(datafile,'r');
status = fseek(fid,numBytes,'bof');     % Skipping first line
numPatch = floor(totlines/validAzPts);  % Number of patches


if(status==-1)
   rawData = NaN;
   return;
end
rawData=zeros(numPatch*validAzPts,nValid);
% Patch data extraction starts
for patchi = 1:numPatch
    fseek(fid,11644,'cof');
    data = fread(fid,[numBytes,numLines],'uint8')'; % Reading raw data file

    % Interpret as complex values and remove mean
    data = complex(data(:,numHdr+1:2:end),data(:,numHdr+2:2:end));
    data = data - mean(data(:));

    rawData((1:validAzPts)+((patchi-1)*validAzPts),:) = data(1:validAzPts,1:nValid);
    fseek(fid,numBytes + numBytes*validAzPts*patchi,'bof');
end
fclose(fid);
end
multilookProcessing
function image = multilookProcessing(slcimg,sx,sy)
[nx,ny] = size(slcimg);
nfx = floor(nx/sx);
nfy = floor(ny/sy);
image = (zeros(nfx,nfy));
for i=1:nfx
    for j = 1:nfy
        fimg=0;
        for ix = 1:sx
            for jy = 1:sy
                fimg = fimg+slcimg(((i-1)*sx)+ix,((j-1)*sy)+jy);
            end
        end
        image(i,j) = fimg/(sx*sy);
    end
end
end
helperDownloadERSData
function helperDownloadERSData(outputFolder,DataURL)
% Download the data set from the given URL to the output folder.

    radarDataZipFile = fullfile(outputFolder,'ERSData.zip');

    if ~exist(radarDataZipFile,'file')

        disp('Downloading ERS data (134 MiB)...');
        websave(radarDataZipFile,DataURL);
        unzip(radarDataZipFile,outputFolder);
    end
end
References
[1] Dataset: ERS-2, ESA 2011. Retrieved from ASF DAAC 10 November 2021.