Signal Feature Extractor
Description
Use Signal Feature Extractor to extract time-domain and frequency-domain features from a signal. You can use the extracted features to train a machine learning model or a deep learning network. Using the app, you can:
Extract statistical, pulse metrics, and harmonic time-domain features.
Extract statistical, bandwidth, and peak-based frequency-domain features.
Extract audio features from imported audio file data. (since R2026a)
Use entire signals or frames.
Use parallel computation to accelerate feature extraction.
Rank signal features using feature-ranking algorithms for classification workflows.
Export labeled signal sets and extracted features.
Signal Feature Extractor saves data as labeledSignalSet
objects, MATLAB® tables, or matrices. You can use labeledSignalSet objects to
train a deep learning classifier or analyze data and report statistics.
For more information, see Use Signal Feature Extractor App.

Open the Signal Feature Extractor App
MATLAB Toolstrip: On the Apps tab, under Signal Processing and Audio, click the app icon.
MATLAB command prompt: Enter
signalFeatureExtractor.
Examples
Extract the RMS, crest factor, and impulse factor features from a multichannel signal.
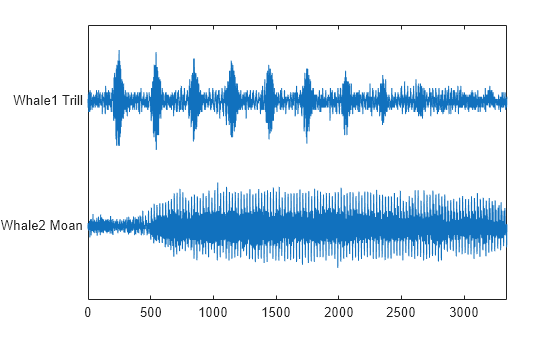
Load the data set labelwhalesignals that includes two recordings (whale1 and whale2) of blue whale songs of trills and moans at a sample rate Fs. For more information about the whale songs data set, see Label Signal Attributes, Regions of Interest, and Points.
load labelwhalesignalsDefine a two-channel signal x as the amplitude of the whales' songs between 2.3819 seconds and 3.2175 seconds. The sample rate Fs is 4 kHz. At this time interval, the song of whale1 is a trill and that of whale2 is a moan.
songIdx = round(2.3819*Fs):round(3.2175*Fs);
x = [whale1(songIdx) whale2(songIdx)];
strips(x)
yticklabels(["Whale2 Moan" "Whale1 Trill"])
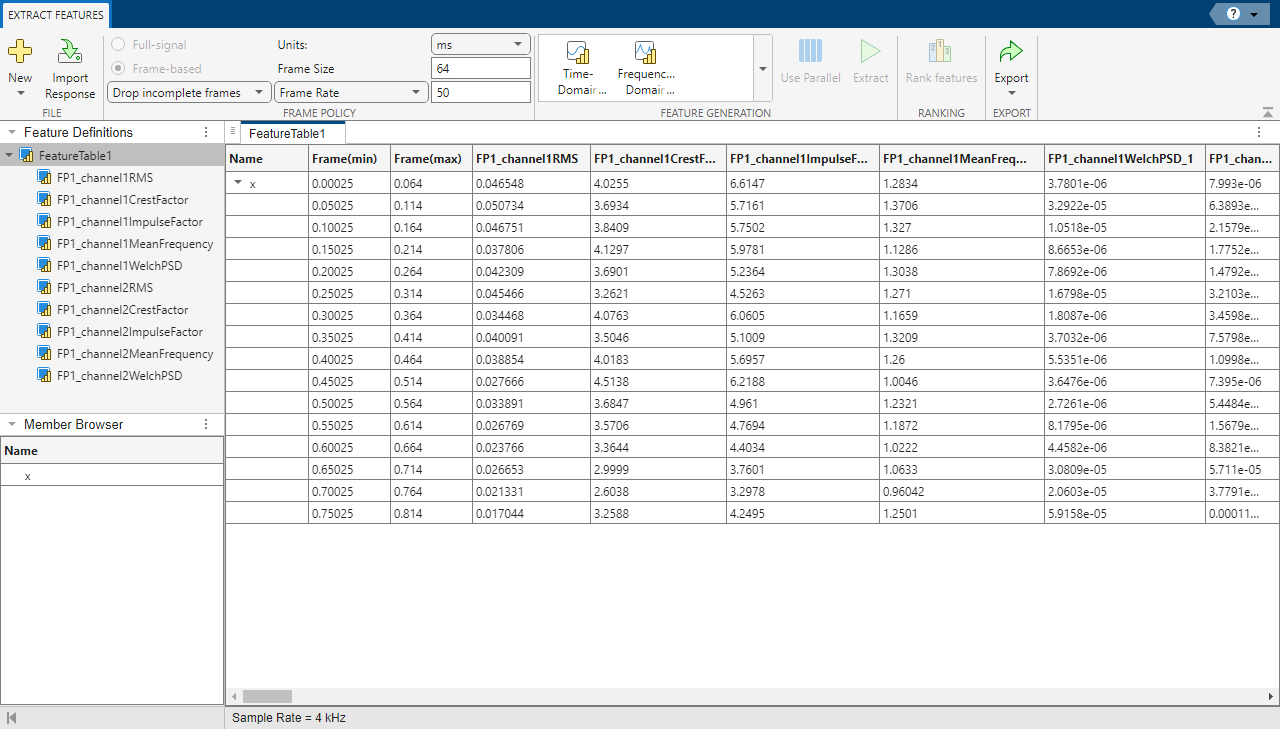
Extract frame-based signal features in the time and frequency domain.
Open Signal Feature Extractor. On the Extract Features tab, click New and select
From Workspacein the Members list.In the dialog box, select the signal
x. Add time information: SelectTimefrom the drop-down list and enter the sample rateFs, which is measured in Hz.Click Import and Close to import the signal and then close the dialog box. The signal appears in the Members browser.
To extract features per signal frame, select Frame-based in the Frame Policy section. Specify a frame size and frame rate of 64 milliseconds and 50 milliseconds, respectively.
Add time-domain features: Click Time-Domain in the Feature Generation gallery. Select
RMS,Crest factor, andImpulse Factor. Click Add Features.Add frequency-domain features: Click Frequency-Domain in the Feature Generation gallery. Select
Mean Frequency, andWelch's PSD. Click Add Features.To extract the selected signal features, click Extract . The app shows the extracted features in the table
FeatureTable1. To see the features along the frames, expand the arrow under the Name column. Each column contains a feature. Welch's PSD vector feature is listed in several columns.
Programmatic Use
Tips
If you have Parallel Computing Toolbox™, you can run multiple feature extraction jobs at the same time. Click Use Parallel to enable the parallelization of the feature extraction. For more information, see Accelerate Feature Extraction with Parallel Computing.
Version History
Introduced in R2025aSee Also
Apps
- Signal Labeler | Classification Learner (Statistics and Machine Learning Toolbox) | Diagnostic Feature Designer (Predictive Maintenance Toolbox)
Objects
signalTimeFeatureExtractor|signalFrequencyFeatureExtractor|audioFeatureExtractor(Audio Toolbox)
Blocks
- Time Feature Extractor (DSP System Toolbox) | Frequency Feature Extractor (DSP System Toolbox)
Live Editor Tasks
- Extract Audio Features (Audio Toolbox)