Main Content

signalFrequencyFeatureExtractor

Streamline signal frequency feature extraction

Since R2021b

    Description

    Use signalFrequencyFeatureExtractor to extract frequency-domain features from a signal. You can use the extracted features to train a machine learning model or a deep learning network.

    Creation

    Description

    sFE = signalFrequencyFeatureExtractor creates a signalFrequencyFeatureExtractor object with default property values.

    sFE = signalFrequencyFeatureExtractor(PropertyName=Value) specifies nondefault property values of the signalFrequencyFeatureExtractor object. For example,

    sFE = signalFrequencyFeatureExtractor( ...
        FrameSize=30,FrameOverlapLength=6,MeanFrequency=true)
    creates a signalFrequencyFeatureExtractor object that partitions a signal into overlapping 30-sample frames and extracts the mean frequency feature from the power spectral density estimate of each frame.

    example

    Properties

    expand all

    Main Properties

    Number of samples per frame, specified as a positive integer. The object divides the signal into frames of the specified length and extracts features for each frame. If you do not specify FrameSize, or if you specify FrameSize as empty, the object extracts features for the whole signal.

    Data Types: single | double

    Number of samples between the start of frames, specified as a positive integer. The frame rate determines the distance in samples between the starting points of frames. If you specify FrameRate, then you must also specify FrameSize. If you do not specify FrameRate or FrameOverlapLength, then the object assumes FrameRate to be equal to FrameSize.

    Note

    You cannot specify FrameRate and FrameOverlapLength simultaneously.

    Data Types: single | double

    Number of overlapping samples between consecutive frames, specified as a positive integer. FrameOverlapLength must be less than or equal to the frame size. If you specify FrameOverlapLength, then you must also specify FrameSize.

    Note

    You cannot specify FrameOverlapLength and FrameRate simultaneously.

    Data Types: single | double

    Input sample rate, specified as a positive scalar in hertz.

    If you do not specify SampleRate, the extract function of the object assumes the signal sampling rate as Hz.

    Data Types: single | double

    Rule to handle incomplete frames, specified as one of these:

    • "drop" — Drop the incomplete frame and do not use it to compute features.

    • "zeropad" — Zero-pad the incomplete frame and use it to compute features.

    This rule applies when the current frame size is less than the specified FrameSize property.

    Data Types: char | string

    Format of the signal features generated by the extract function, specified as one of these:

    • "matrix" — Columns correspond to feature values.

    • "table" — Each table variable corresponds to a feature value.

    Note

    You can generate features for multiple signals at once by specifying a datastore object input in the extract function. In this case, extract returns a cell array where each member corresponds to a feature matrix or table from a signal member of the datastore. The format of the generated features in each member follows the format specified in FeatureFormat.

    Data Types: char | string

    Since R2024b

    Methods to convert feature vectors to scalar values, specified as a frequencyScalarFeatureOptions object.

    You can specify methods to extract scalar values from Features to Extract. Specify scalarization methods for the feature extractor object by using the ScalarizationMethod name-value argument or the setScalarizationMethods function.

    • If you specify ScalarizationMethod, the signalFrequencyFeatureExtractor object returns the corresponding scalar values for each feature vector using the scalarization method.

      To convert a feature vector to scalar feature values:

      • You must enable the feature for extraction by setting the feature name in the signalFrequencyFeatureExtractor object to true.

      • You must specify the desired scalarization methods for each feature name using a cell array of character vectors or a string array and store the information in a frequencyScalarFeatureOptions object.

      After that, the extract function:

      • Extracts the vectors corresponding to each enabled feature.

      • Takes the list of scalarization methods compiled by the object and for each method computes the corresponding scalar value.

      • Concatenates the vector features and the scalar features.

    • If you do not specify ScalarizationMethod, the signalFrequencyFeatureExtractor object does not perform any scalarization.

    For more information about scalarization methods, see Scalarization Methods for Frequency-Domain Features.

    Features to Extract

    Extract signal features in the frequency domain from the signal's frequency-domain representation. You can extract these frequency-domain features: mean frequency, median frequency, band power, occupied bandwidth, power bandwidth, power spectral density (Welch PSD) estimate, peak amplitude, and peak location.

    Note

    To compute frequency-domain features specified in a signalFrequencyFeatureExtractor object, the extract function first estimates the PSD of the input time-domain signal using Welch's method. The function uses the computed Welch PSD and corresponding frequency vector to compute the specified features. You can configure the computed Welch PSD estimate using the setExtractorParameters function. For more information, see WelchPSD.

    Specify the features to extract as name-value arguments Name1=true,...,NameN=true, where Name is the feature name. The order of the arguments does not matter. For example, this code creates a frequency-domain feature extractor object to extract the mean frequency and band power from the power spectral density estimate of a signal.

    sFE = signalFrequencyFeatureExtractor(MeanFrequency=true,BandPower=true)

    Option to extract the mean frequency of the power spectrum, specified as true or false.

    If you specify this feature as true:

    • The feature-extractor object enables this feature for extraction.

    • The extract function extracts this feature and concatenates it with all the other features that you enable in the feature-extractor object.

    For more information about the mean frequency feature, see meanfreq.

    Data Types: logical

    Option to extract the median frequency of the power spectrum, specified as true or false.

    If you specify this feature as true:

    • The feature-extractor object enables this feature for extraction.

    • The extract function extracts this feature and concatenates it with all the other features that you enable in the feature-extractor object.

    For more information about the median frequency feature, see medfreq.

    Data Types: logical

    Option to extract the average band power, specified as true or false.

    If you specify this feature as true:

    • The feature-extractor object enables this feature for extraction.

    • The extract function extracts this feature and concatenates it with all the other features that you enable in the feature-extractor object.

    For more information about the band power feature, see bandpower.

    Data Types: logical

    Option to extract the 99% occupied bandwidth, specified as true or false.

    If you specify this feature as true:

    • The feature-extractor object enables this feature for extraction.

    • The extract function extracts this feature and concatenates it with all the other features that you enable in the feature-extractor object.

    To set parameters of the occupied bandwidth extraction, use setExtractorParameters.

    setExtractorParameters(sFE,"OccupiedBandwidth",Name=Value)
    Settable parameters for the occupied bandwidth extraction are:

    • Percentage — Power percentage, specified as a positive integer scalar less than 100.

    For more information about the occupied bandwidth feature, see obw.

    Data Types: logical

    Option to extract the 3 dB (half-power) bandwidth, specified as true or false.

    If you specify this feature as true:

    • The feature-extractor object enables this feature for extraction.

    • The extract function extracts this feature and concatenates it with all the other features that you enable in the feature-extractor object.

    To set parameters of the half-power bandwidth extraction, use setExtractorParameters.

    setExtractorParameters(sFE,"PowerBandwidth",Name=Value)
    Settable parameters for the half-power bandwidth extraction are:

    • RelativeAmplitude — Relative amplitude, specified as a real-valued scalar. The value specified in RelativeAmplitude represents the power level drop of the power spectral density in dB.

    For more information about the half-power bandwidth feature, see powerbw.

    Data Types: logical

    Option to extract the power spectral density (PSD) estimate, specified as true or false.

    If you specify this feature as true:

    • The feature-extractor object enables this feature for extraction.

    • The extract function extracts this feature and concatenates it with all the other features that you enable in the feature-extractor object.

    To set parameters of the Welch's PSD estimate, use setExtractorParameters.

    setExtractorParameters(sFE,"WelchPSD",Name=Value)
    Settable parameters for the Welch's PSD estimate extraction are:

    • FFTLength — Number of DFT points, specified as a positive integer scalar.

    • FrequencyVector — Frequencies at which the PSD is estimated, specified as a vector with at least two elements. You can specify FrequencyVector only when FFTLength is not specified.

    • OverlapLength — Number of overlapping samples, specified as a positive integer scalar.

    • Window — Window, specified as a scalar or vector.

    For more information about the power spectral density estimate feature, see pwelch.

    Data Types: logical

    Option to extract the peak spectral amplitudes, specified as true or false.

    If you specify this feature as true:

    • The feature-extractor object enables this feature for extraction.

    • The extract function extracts this feature and concatenates it with all the other features that you enable in the feature-extractor object.

    To set parameters of the peak amplitude extraction, use setExtractorParameters.

    setExtractorParameters(sFE,"PeakAmplitude",Name=Value)
    Settable parameters for the peak amplitude extraction are:

    • PeakType — Type of peak, specified as "minima" or "maxima".

    • MaxNumExtrema — Maximum number of peaks, specified as a positive integer scalar.

    • MinProminence — Minimum prominence, specified as a positive scalar. The object returns only peaks whose prominence is at least the value specified.

    • MinSeparation — Minimum separation between peaks, in samples, specified as a positive scalar.

    • FlatSelection — Flat region indicator, specified as one of these:

      • "center" — Indicate only the center element of a flat region as the peak.

      • "first" — Indicate only the first element of a flat region as the peak.

      • "last" — Indicate only the last element of a flat region as the peak.

      • "all" — Indicate all elements of a flat region as the peak.

    For more information about the peak amplitude feature, see pwelch, islocalmax, and islocalmin.

    Data Types: logical

    Option to extract the spectral peak locations, specified as true or false.

    If you specify this feature as true:

    • The feature-extractor object enables this feature for extraction.

    • The extract function extracts this feature and concatenates it with all the other features that you enable in the feature-extractor object.

    To set parameters of the peak location extraction, use setExtractorParameters.

    setExtractorParameters(sFE,"PeakLocation",Name=Value)
    Settable parameters for the peak location extraction are:

    • PeakType — Type of peak, specified as "minima" or "maxima".

    • MaxNumExtrema — Maximum number of peaks, specified as a positive integer scalar.

    • MinProminence — Minimum prominence, specified as a positive scalar. The setExtractorParameters function returns only peaks whose prominence is at least the value specified.

    • MinSeparation — Minimum separation between peaks, in samples, specified as a positive scalar.

    • FlatSelection — Flat region indicator, specified as one of these:

      • "center" — Indicate only the center element of a flat region as the peak.

      • "first" — Indicate only the first element of a flat region as the peak.

      • "last" — Indicate only the last element of a flat region as the peak.

      • "all" — Indicate all elements of a flat region as the peak.

    For more information about the peak location feature, see pwelch, islocalmax, and islocalmin.

    Data Types: logical

    Object Functions

    extractExtract time-domain, frequency-domain, or time-frequency-domain features
    generateMATLABFunctionCreate MATLAB function compatible with C/C++ code generation
    getExtractorParametersGet current parameter values of feature extractor object
    getScalarizationMethodsGet scalarization methods for domain-specific signal features
    setExtractorParametersSet nondefault parameter values for feature extractor object
    setScalarizationMethodsSet scalarization methods for domain-specific signal features

    Examples

    collapse all

    Since R2025a

    Extract frequency-domain features from a synthetic power-supply signal with harmonics.

    Generate a sinusoidal signal with an amplitude of 1102 V, a frequency of 50 Hz, and add third-, fifth-, and seventh-order harmonics. The harmonic relative amplitudes are 0.15, 0.03, and 0.01, respectively. Sample the signal for 5 seconds at a sample rate of 1000 Hz.

    rng("default")
    Fs = 1000;
    t = (0:1/Fs:5-1/Fs)';
    a = 110*sqrt(2)*[1 0.15 0.03 0.01];
    f = 50*[1 3 5 7];
    x = cos(2*pi*f.*t)*a' + randn(size(t));

    Plot the 1024-point power spectral density (PSD) estimate of the signal.

    nfft = 1024;
    pwelch(x,[],[],nfft,Fs)
    xlabel("Frequency (Hz)")
    ylabel("Amplitude (dB)")

    Figure contains an axes object. The axes object with title Welch Power Spectral Density Estimate, xlabel Frequency (Hz), ylabel Amplitude (dB) contains an object of type line.

    Create a frequency-domain feature extractor object. Set the frame size so that each frame is one second long. Set up the object to extract the peak amplitudes and locations of the PSD estimate a signal.

    sFE = signalFrequencyFeatureExtractor(SampleRate=Fs, ...
        PeakAmplitude=true,PeakLocation=true)
    sFE = 
      signalFrequencyFeatureExtractor with properties:
    
       Properties
                  FrameSize: []
                  FrameRate: []
                 SampleRate: 1000
        IncompleteFrameRule: "drop"
              FeatureFormat: "matrix"
        ScalarizationMethod: [1×1 frequencyScalarFeatureOptions]
    
       Enabled Features
         PeakAmplitude, PeakLocation
    
       Disabled Features
         MeanFrequency, MedianFrequency, BandPower, OccupiedBandwidth, PowerBandwidth, WelchPSD


    Configure the feature extractor parameters to extract the fundamental frequency and the harmonics. Use 1024 DFT points to calculate the PSD estimate, which is used to extract the frequency-domain features.

    numPeaks = 4;
    setExtractorParameters(sFE,"PeakAmplitude", ...
        "MinProminence",0.13,"MaxNumExtrema",numPeaks)
    setExtractorParameters(sFE,"PeakLocation", ...
        "MinProminence",0.13,"MaxNumExtrema",numPeaks)
    setExtractorParameters(sFE,"WelchPSD","FFTLength",nfft)

    Extract the features from the sinusoidal signal with harmonics. Display the peak amplitudes in dB and the peak locations in Hz. The peak amplitudes and locations correspond with the signal's fundamental frequency and harmonics, respectively.

    [features,indices] = extract(sFE,x);
    amplitudes = pow2db(features(indices.PeakAmplitude))
    amplitudes = 1×4
    
       39.6125   22.1592    9.4983   -1.4240
    
    
    locations = features(indices.PeakLocation)
    locations = 1×4
    
       49.8047  150.3906  250.0000  349.6094


    Generate 1024 samples of a chirp sampled at 1024 kHz. The chirp has an initial frequency of 50 kHz and reaches 100 kHz at the end of the sampling. Add white Gaussian noise such that the signal-to-noise ratio is 40 dB. Plot the power spectral density (PSD) and annotate the mean frequency and occupied bandwidth of the signal.

    nSamp = 1024;
    Fs = 1024e3;
    SNR = 40;
    
    t = (0:nSamp-1)'/Fs;
    
    x0 = chirp(t,50e3,nSamp/Fs,100e3);
    x = x0+randn(size(x0))*std(x0)/db2mag(SNR);
    
    [pxx,f]= pwelch(x,[],[],[],Fs);
    obw(pxx,f);
    m = meanfreq(pxx,f);
    xline(m/1000,"--", ...
        "Mean Frequency Estimate: "+m/1000+" kHz")

    Figure contains an axes object. The axes object with title 99% Occupied Bandwidth: 43.783 kHz, xlabel Frequency (kHz), ylabel Power/frequency (dB/Hz) contains 5 objects of type line, patch, constantline.

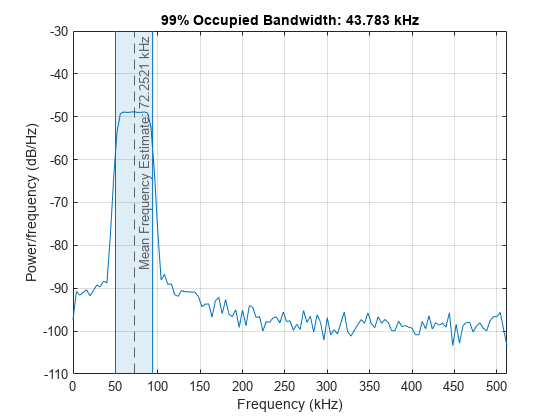
    Create a signalFrequencyFeatureExtractor object to extract the mean frequency, 99% occupied bandwidth, and 3 dB bandwidth of the signal.

    sFE = signalFrequencyFeatureExtractor(SampleRate=Fs, ...
        MeanFrequency=true,OccupiedBandwidth=true,PowerBandwidth=true)
    sFE = 
      signalFrequencyFeatureExtractor with properties:
    
       Properties
                  FrameSize: []
                  FrameRate: []
                 SampleRate: 1024000
        IncompleteFrameRule: "drop"
              FeatureFormat: "matrix"
        ScalarizationMethod: [1×1 frequencyScalarFeatureOptions]
    
       Enabled Features
         MeanFrequency, OccupiedBandwidth, PowerBandwidth
    
       Disabled Features
         MedianFrequency, BandPower, WelchPSD, PeakAmplitude, PeakLocation


    Call the extract function to extract the specified features.

    [features,info] = extract(sFE,x)
    features = 1×3
    104 ×
    
        7.2252    4.3783    3.7773
    
    
    info = struct with fields:
            MeanFrequency: 1
        OccupiedBandwidth: 2
           PowerBandwidth: 3


    To view the extracted features in a table, modify the FeatureFormat property of the object.

    sFE.FeatureFormat = "table";
    featureTable = extract(sFE,x)
    featureTable=1×5 table
        FrameStartTime    FrameEndTime    MeanFrequency    OccupiedBandwidth    PowerBandwidth
        ______________    ____________    _____________    _________________    ______________
    
              1               1024            72252              43783              37773     


    You can use the getExtractorParameters function to view parameters used to compute a specified feature. The occupied bandwidth measures the bandwidth containing 99% of the total power for the input signal by default. Use the setExtractorParameters function to change the percentage to 95% and extract the specified features again.

    params = getExtractorParameters(sFE,"OccupiedBandwidth")
    params = struct with fields:
        Percentage: []
    
    
    params.Percentage = 95;
    setExtractorParameters(sFE,OccupiedBandwidth=params)
    featuresTable2 = extract(sFE,x)
    featuresTable2=1×5 table
        FrameStartTime    FrameEndTime    MeanFrequency    OccupiedBandwidth    PowerBandwidth
        ______________    ____________    _____________    _________________    ______________
    
              1               1024            72252              39840              37773     


    Since R2025a

    Extract time-domain, frequency-domain, and time-frequency features from healthy bearing vibration signals and faulty bearing vibration signals. While a healthy bearing vibration signal does not have outstanding defects, a faulty bearing vibration signal results from wear-and-tear defects, such as spalls on the gear teeth, eccentricity or gear misalignment, and cracks at the races.

    For more information on bearing signal generation and analysis, see Vibration Analysis of Rotating Machinery. To learn more about the feature extraction and model training workflow to identify faulty bearing signals in mechanical systems, see Machine Learning and Deep Learning Classification Using Signal Feature Extraction Objects.

    Generate Healthy Bearing Signal

    Generate a healthy bearing vibration signal as a sum of three cosine pulses with amplitudes of 0.4 V, 0.2 V, and 1 V, respectively, and frequencies of 22.5 Hz, 8.36 Hz, and 292.5 Hz, respectively, for three seconds and with a sample rate of 20 kHz. Generate Gaussian noise and add it to the signal.

    rng("default")
    Fs = 20e3;
    t = (0:1/Fs:3-1/Fs)';
    
    a = [0.4 0.2 1];
    f = [22.5 8.36 292.5];
    sClean = cos(2*pi*f.*t)*a';
    sHealthy = sClean + 0.2*randn(size(t));

    Generate Faulty Bearing Signal

    Generate a faulty bearing vibration signal by adding a bearing impact signal to the healthy bearing signal. Model each impact as a 3 kHz sinusoid windowed by a Kaiser window. The defect causes a series of 10-millisecond impacts on the bearing.

    tImpact = t(t<10e-3)';
    xImpact = sin(2*pi*3000*tImpact).*kaiser(length(tImpact),40)';
    
    xImpactBper = 0.33*pulstran(t,0:1/104.5:t(end),xImpact,Fs);

    Generate a faulty bearing vibration signal as a sum of the healthy bearing signal, the bearing impact signal, and additive Gaussian noise.

    sFaulty = sHealthy + xImpactBper;

    Consolidate and Visualize Signals

    Bundle the healthy bearing and faulty bearing signals in a signalDatastore object in single precision.

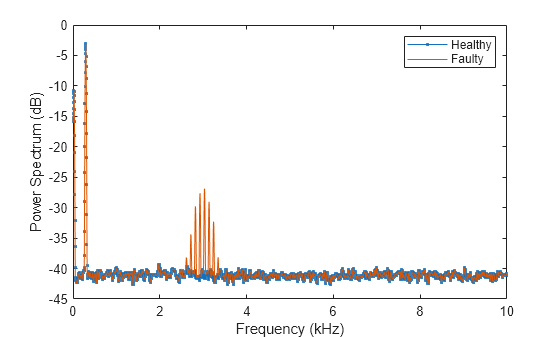
    sds = signalDatastore({sHealthy,sFaulty},OutputDataType="single");

    Plot the power spectrum of the healthy and faulty vibration signals. Observe the peaks that correspond to the bearing impact.

    [P,F] = pspectrum([sHealthy sFaulty],Fs);
    p = plot(F/1000,pow2db(P));
    p(1).Marker = ".";
    xlabel("Frequency (kHz)")
    ylabel("Power Spectrum (dB)")
    legend(["Healthy" "Faulty"])

    Figure contains an axes object. The axes object with xlabel Frequency (kHz), ylabel Power Spectrum (dB) contains 2 objects of type line. These objects represent Healthy, Faulty.

    Set Up Feature Extraction Pipeline

    Create a signalTimeFeatureExtractor object for time-domain feature extraction.

    timeFE = signalTimeFeatureExtractor(SampleRate=Fs,...
        RMS=true,ImpulseFactor=true,StandardDeviation=true);

    Create a signalFrequencyFeatureExtractor object for frequency-domain feature extraction.

    freqFE = signalFrequencyFeatureExtractor(SampleRate=Fs, ...
        MedianFrequency=true,BandPower=true,PeakAmplitude=true);

    Create a signalTimeFrequencyFeatureExtractor object to extract time-frequency features from a spectrogram. Set the leakage parameter for the spectrogram to 90%.

    timeFreqFE = signalTimeFrequencyFeatureExtractor(SampleRate=Fs, ...
        SpectralKurtosis=true,SpectralSkewness=true,TFRidges=true);
    
    setExtractorParameters(timeFreqFE,"spectrogram",Leakage=0.9);

    Extract Multidomain Features

    Extract signal features using all three feature extractors for the signals in the signalDatastore object. Concatenate and display the features in a multidomain feature table.

    features = cellfun(@(a,b,c) [real(a) real(b) real(c)], ...
        extract(timeFE,sds),extract(freqFE,sds),extract(timeFreqFE,sds), ...
        UniformOutput=false);
    
    featureMatrix = cell2mat(features);
    featureTable = array2table(featureMatrix);
    rows2vars(featureTable)
    ans=579×3 table
        OriginalVariableNames     Var1       Var2  
        _____________________    _______    _______
    
         {'featureMatrix1' }     0.80115    0.80538
         {'featureMatrix2' }     0.80116    0.80539
         {'featureMatrix3' }      3.2635     3.1501
         {'featureMatrix4' }      292.39     292.41
         {'featureMatrix5' }     0.64086    0.64764
         {'featureMatrix6' }     0.20977    0.20977
         {'featureMatrix7' }      27.474     25.423
         {'featureMatrix8' }      35.088     32.666
         {'featureMatrix9' }      25.867     24.521
         {'featureMatrix10'}      29.091     26.485
         {'featureMatrix11'}      36.085     32.242
         {'featureMatrix12'}       32.92     31.423
         {'featureMatrix13'}      24.421     22.288
         {'featureMatrix14'}      26.056     24.772
         {'featureMatrix15'}       30.36     28.084
         {'featureMatrix16'}      26.464     25.432
          ⋮


    More About

    expand all

    Algorithms

    Assume an input signal x sampled at a rate Fs, from which to extract frequency-domain features. When you specify signal framing properties (FrameSize, FrameRate or FrameOverlapLength, and IncompleteFrameRule), the feature extractor sets up the signal partitioning operation for x to extract features for each frame. This table shows the equivalent syntaxes that signalFrequencyFeatureExtractor uses to partition the signal x into frames of size fl, frame rate fr or frame overlap length ol, and incomplete frame rule ifr.

    Frame SpecificationsFeature Extractor Object SpecificationSignal Framing Operation Equivalency


    FrameSize
    FrameRate
    IncompleteFrameRule

    sFE = signalFrequencyFeatureExtractor( ...
        FrameSize=fl,FrameRate=fr, ...
        IncompleteFrameRule=ifr);
    xFrames = framesig(x,fl, ...
        OverlapLength=fl-fr, ...
        IncompleteFrameRule=ifr);


    FrameSize
    FrameOverlapLength
    IncompleteFrameRule

    sFE = signalFrequencyFeatureExtractor( ...
        FrameSize=fl,FrameOverlapLength=ol, ...
        IncompleteFrameRule=ifr);
    xFrames = framesig(x,fl, ...
        OverlapLength=ol, ...
        IncompleteFrameRule=ifr);

    If you do not specify signal framing properties, signalFrequencyFeatureExtractor considers x as a single-framed signal.

    Given the single-framed input signal x and sample rate Fs, this table lists the equivalent syntaxes for extracting features using the signalFrequencyFeatureExtractor object and the individual feature extractor functions.

    FeaturesFeature Extractor ObjectIndividual Feature Extractors


    MeanFrequency
    MedianFrequency
    BandPower
    OccupiedBandwidth
    PowerBandwidth
    WelchPSD
    PeakAmplitude
    PeakLocation

    sFE = signalFrequencyFeatureExtractor( ...
        SampleRate=Fs, ...
        MeanFrequency=true, ...
        MedianFrequency=true, ...
        BandPower=true, ...
        OccupiedBandwidth=true, ...
        PowerBandwidth=true, ...
        WelchPSD=true, ...
        PeakAmplitude=true, ...
        PeakLocation=true);
    
    features = extract(sFE,x);
    [P,F] = pwelch(x,[],[],[],Fs);
    features = [ ...
        meanfreq(P,F) ...
        medfreq(P,F) ...
        bandpower(P,F,"psd") ...
        obw(P,F) ...
        powerbw(P,F) ...
        P' ...
        P(islocalmax(P,MaxNumExtrema=1)) ...
        F(islocalmax(P,MaxNumExtrema=1)) ...
        ];
     

    Note

    • Because signalFrequencyFeatureExtractor reuses intermediary representations, the features that signalFrequencyFeatureExtractor outputs might not correspond with the default configuration of features output by the corresponding individual feature extraction functions.

    • To obtain the equivalent syntax for the feature extraction setup based on the properties specified when you create the signalFrequencyFeatureExtractor object, use generateMATLABFunction.

    Extended Capabilities

    expand all

    Version History

    Introduced in R2021b

    expand all