ashow
Identify and highlight algebraic loops in simulation debugging session
Description
ashow displays in the MATLAB® Command Window a list of algebraic loops in the model for the current
simulation debugging session.
You can use this function in a simulation debugging session started:
Note
This function is available only for simulation debugging sessions started programmatically and for interactive simulation debugging sessions while paused within a time step.
ashow displays in the MATLAB Command Window information about the algebraic loop that contains the block
blkblk. When the block blk is part of an algebraic
loop, this command also highlights the algebraic loop that contains the block
blk in the block diagram.
ashow displays in the MATLAB Command Window information about the algebraic loop aloopaloop
and highlights the algebraic loop in the block diagram.
ashow clear removes algebraic loop highlighting from the block
diagram.
Examples
Use the ashow function to examine algebraic
loops in the model sldemo_hydcyl.
Open the model sldemo_hydcyl.
openExample("simulink_general/sldemo_hydcylExample",...
    supportingFile="sldemo_hydcyl.slx")
Start a simulation debugging session for the model using the
sldebug function. The MATLAB Command Prompt (>>) becomes the Simulink debugger prompt ((sldebug @0): >> ).
sldebug sldemo_hydcyl(sldebug @0): >>
Use the step function to step to the first method in the first
major time step for the simulation.
step top%----------------------------------------------------------------% [TM = 0 ] sldemo_hydcyl.Outputs.Major
Use the ashow function to show a list of algebraic loops in the
model.
ashow
Found 1 Algebraic loop(s):
System number#Algebraic loop id, number of blocks in loop
- (0)0#1, 9 block(s) in loop
Use the algebraic loop identifier in the information returned by the
ashow function to get more information about the algebraic loop.
The ashow function lists the paths to the nine blocks in the loop
and identifies which blocks correspond to algebraic variables in the loop.
ashow (0)0#1
- sldemo_hydcyl/Valve/Cylinder/Piston/Spring Assembly/Control Valve Flow/IC
- sldemo_hydcyl/Valve/Cylinder/Piston/Spring Assembly/Control Valve Flow/Sqrt
- sldemo_hydcyl/Valve/Cylinder/Piston/Spring Assembly/Control Valve Flow/Product
- sldemo_hydcyl/Valve/Cylinder/Piston/Spring Assembly/laminar flow pressure drop
- sldemo_hydcyl/Valve/Cylinder/Piston/Spring Assembly/Sum7
- sldemo_hydcyl/Pump/IC
- sldemo_hydcyl/Valve/Cylinder/Piston/Spring Assembly/Control Valve Flow/Sum1 (algebraic variable)
- sldemo_hydcyl/Pump/Sum1
- sldemo_hydcyl/Pump/leakage (algebraic variable)
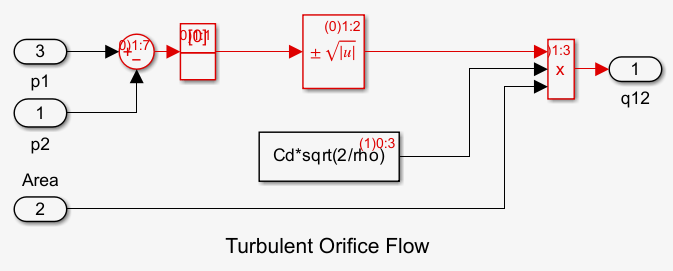
The ashow function also highlights the specified loop in the
block diagram. In this model, the loop includes blocks in two different levels of the
model hierarchy, so only the blocks in the Control Valve Flow masked
subsystem are visible.
When you have finished analyzing and debugging the model, use the
stop function to end the simulation debugging session.
stop
Input Arguments
Tips
To start a simulation debugging session interactively, add one
or more breakpoints to your model, and in the Breakpoints List,
check that Pause within time step is selected. When the simulation pauses
on a breakpoint, some of the programmatic debugging commands, such as the
stop command, are available for use in the MATLAB Command Window.