Step Through Simulations Using the Simulink Editor
This example shows how to step through simulations. By using controls in the Simulink Editor, you can advance a simulation by one or more time steps or step through a time step by advancing the simulation block by block.
This example illustrates only capabilities and options related to stepping through simulation. To pause at points you want to investigate by stepping through the simulation, use signal breakpoints. For more information, see Debug Simulation Using Signal Breakpoints.
To step forward through one or more time steps in scripted simulations, use the
Simulation object.
Open Model and Set Up Debugging Tools
Open the model vdp, which implements the Van der Pol equation. For more information about the model, see Van der Pol Oscillator.
openExample("simulink_general/VanDerPolOscillatorExample",...
    supportingFile="vdp")

Before starting the simulation, set up the relevant debugging tools.
To step through time steps block by block, check that the simulation mode is set to
Normalin the model and that low-level debugging is enabled.In the Simulink® Toolstrip:
On the Simulation tab or the Debug tab, in the Simulate section, check that the Simulation mode list selection is
Normal.On the Debug tab, in the Breakpoints section, click Breakpoints List. In the Breakpoints List, check that Pause within time step is selected.
To save time in iterative debugging simulations, enable fast restart.
In the Simulink Toolstrip, on the Simulation tab, click Fast Restart.
To view signal values in the block diagram as you step through the simulation, add port value labels.
Click an empty area in the upper left of the canvas and drag to select everything in the block diagram. Then, on the Debug tab, in the Tools section, in the Port Values button group, click Show port value label on selected signal
 . After you add the port value labels, each signal shows
 no data yetuntil the simulation advances to a point that provides a new value to the port value label.
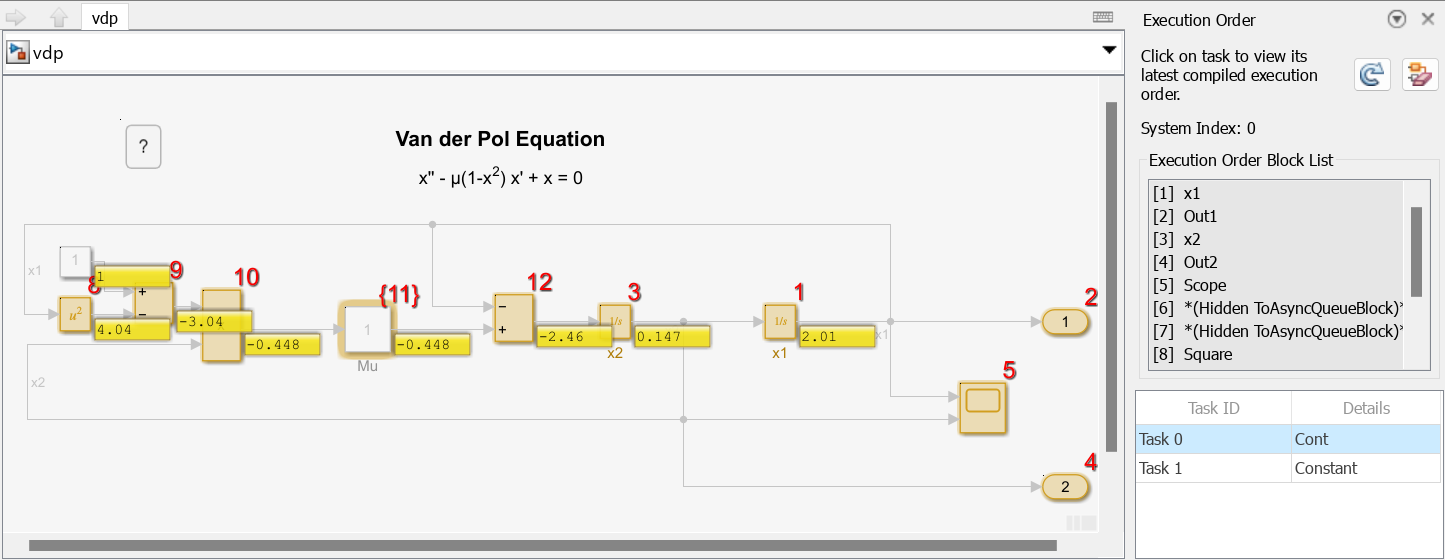
To view the execution order while stepping block by block, open the Execution Order viewer.
In the Breakpoints List, click Open the Execution Order Viewer
 .
.
Tip
To enable stepping into MATLAB Function blocks and Stateflow® charts, select Allow setting breakpoints during simulation before starting a debugging simulation.
Step Forward Through Simulation Time Steps
To start a simulation of the model vdp, in the Simulink Toolstrip, on the Simulation tab, click
Step Forward. The simulation starts and pauses after
calculating values for the first time step in the simulation, which corresponds to
the simulation start time.

To monitor the simulation status and simulation time, use the status bar at the bottom of the Simulink Editor. While the simulation is paused, the progress bar indicates the simulation status. The status bar shows the simulation time of the time step that most recently computed output values. The asterisk on the simulation time indicates that the simulation time in the internal state of the simulation is ahead of the time displayed in the status bar.
![]()
By default, each time you click Step Forward, the simulation advances by one time step. The time in the status bar updates, and the port value labels update to display the new signal values.
To advance the simulation by multiple time steps each time you click
Step Forward, configure the simulation stepping options. To
open the Simulation
Stepping Options dialog box, click the Step Back
button arrow then select Configure Simulation Stepping. In the
Simulation Stepping Options dialog box, specify Move
back/forward by as 5. Then, click
OK.
Now, when you click Step Forward, the simulation advances through five time steps. In the status bar, you can see the overall simulation progress and that the time changes by a larger increment when you step forward.
Double-click the Scope block. The plot updates to display the data
for the signals x1 and x2 as the simulation
advances. Click Step Forward to see the Scope
block update to display data from five more time steps.

Step Through Time Steps Block by Block
To analyze how the simulation computes signal values for your model, you can step through time steps block by block. Stepping block by block advances the simulation one block at a time according to the execution order determined during the initialization phase of the simulation. For more information about how the software determines the execution order, see Control and Display Execution Order.
To help you keep track of where the simulation is paused both within the execution
order and in the block diagram, use the Execution Order viewer while
stepping block by block. To view the execution order for the model
vdp, in the Execution Order viewer, select
Task 0. The Execution Order viewer displays
the execution order as a list and annotates the block diagram with the execution
order for blocks that execute in Task 0. The block list in the
Execution Order viewer includes hidden blocks added by the software
that do not appear in the block diagram.

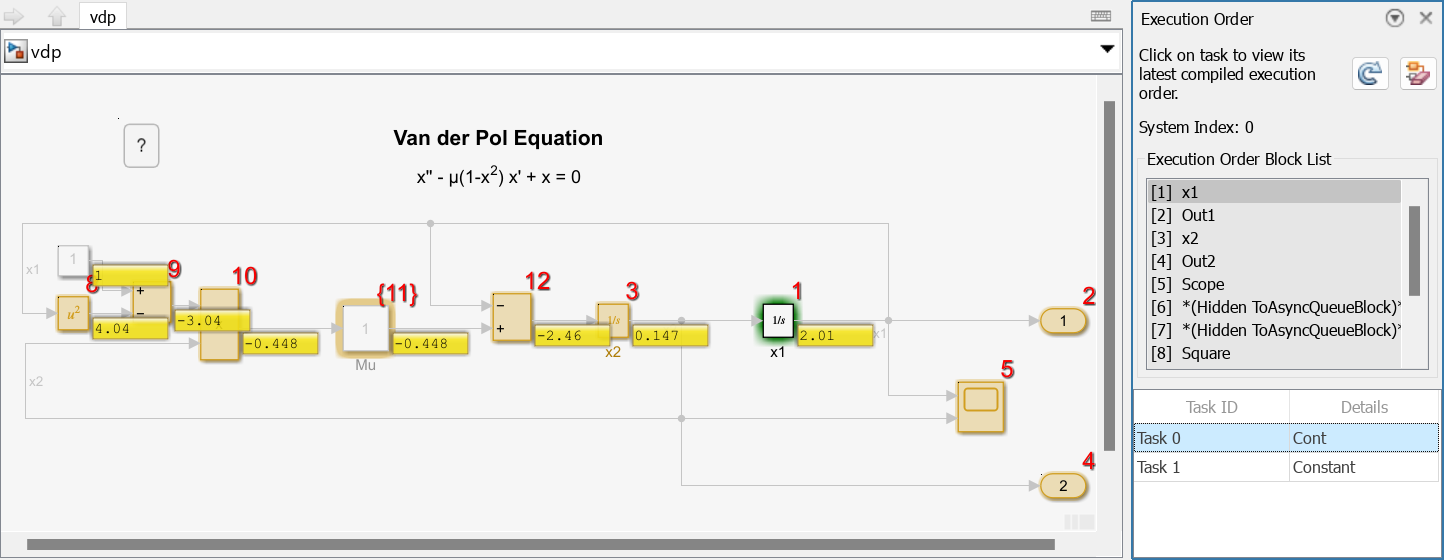
To start stepping through the simulation block by block, in the Simulink Toolstrip, on the Debug tab, click Step
Over. The simulation pauses just before executing the first block in
the execution order for task 0. The green highlight on the Integrator
block named x1 indicates in the block diagram where the
simulation is paused. The Execution Order viewer indicates where the
simulation is paused by highlighting the corresponding row in the execution list for
task 0.

The status string on the left of the status bar includes the path to the block
named x1 to indicate where the simulation is paused.
![]()
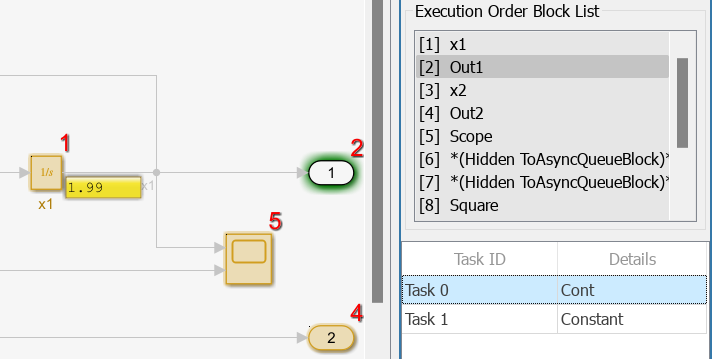
To execute the block named x1, click Step
Over again. The simulation advances and pauses just before executing
the next block in the execution order. The green highlight moves to the
Outport block named Out1. The Execution Order
viewer highlights the row for the block named Out1. The port
value label on the signal named x1 updates to show the new value
calculated for the current time step.

Continue stepping through the time step by clicking Step Over. As you step, you can see how the output value of each block changes and the input values each block uses to calculate the output value for the step.
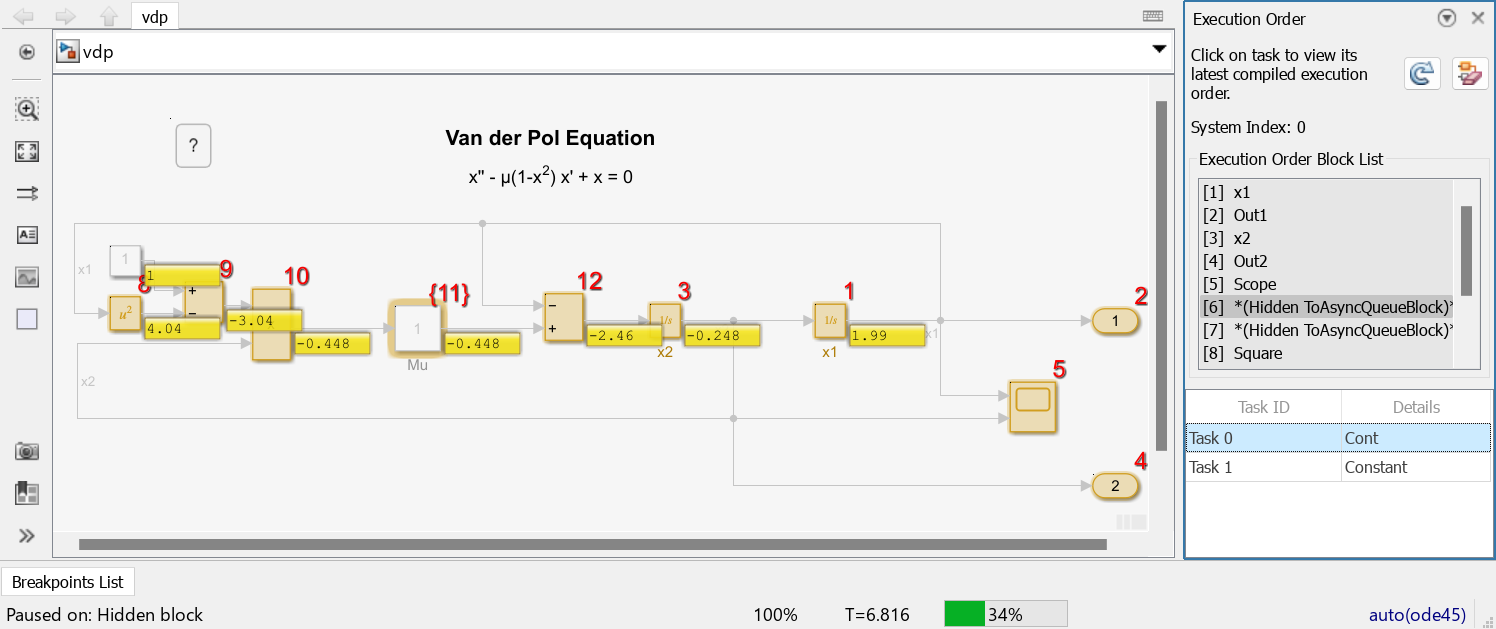
After the Scope block executes, the simulation pauses on a hidden block. The software adds hidden blocks for several reasons, such as automatically resolving certain modeling issues and logging simulation data. Because the software does not display hidden blocks in the block diagram, the block diagram does not show the green highlight on any block to indicate where the simulation is paused. The Execution Order viewer highlights the row for the hidden block, and the status string indicates that the simulation is paused on a hidden block.

Continue advancing the simulation block by block by clicking Step
Over until the simulation pauses on the Sum block.
When you click Step Over to execute the Sum
block, the simulation advances to the next time step and pauses just before
executing the first block in the execution order, the block named
x1.
To advance the simulation through the current time step and pause before evaluating the next time step, click Step Forward.
Note
While paused within a time step, you can use some functions from the sldebug programmatic interface to get additional information about the
simulation. For example, you could use the probe function to view
information about a specified block. The values displayed by functions in the
sldebug programmatic interface might be different from the values
displayed by port value labels. The functions in the sldebug
programmatic interface display values computed for both minor time steps and major time
steps. Port value labels display values for only major time steps. For more information, see
Simulink Debugging Programmatic Interface.
Step Backward Through Time Steps
In addition to advancing the simulation forward through time steps or block by block, you can also step the simulation backward through one or more time steps. To support stepping back in simulation, the software captures snapshots of the model operating point while advancing forward in simulation. Because capturing these snapshots requires memory and can affect simulation performance, stepping back in simulation is disabled by default. For more information, see How Stepping Through Simulations Works.
To enable stepping back in simulation:
Open the Simulation Stepping Options dialog box.
In the Simulink Toolstrip, on the Simulation tab or the Debug tab, click the Step Back button arrow, and then select Configure Simulation Stepping.
In the Simulation Stepping Options dialog box, select Enable stepping back.
Click OK.
Because stepping back was not enabled at the start of simulation, the software does not have a snapshot for any prior time steps in the simulation. Before you can step back, you must step forward. Even after you step forward, you cannot step back in the simulation farther than the simulation time step in which you enabled stepping back.
Click Step Forward twice. Then, click Step Back. In the status bar, the simulation time updates to reflect the step back. The port value labels also update to display the value from the time to which you stepped back.

When you click Step Back a second time, the software disables the Step Back button because you cannot step back farther in this simulation.
Finish or Stop Simulation
When you are done stepping through the simulation, you can continue the simulation until the end or stop the simulation at the current time step.
To run the simulation through the simulation stop time, in the Simulink Toolstrip, on the Simulation tab or the Debug tab, click Continue.
To stop the simulation at the current time step, in the Simulink Toolstrip, on the Simulation tab or the Debug tab, click Stop.