Lookup Table Overview
R2026bReal-world systems often exhibit nonlinear behavior that is difficult to express analytically. A lookup table is an array of data that maps input values to output values, thereby approximating a mathematical function. Given a set of input values, a Simulink® Lookup Table block retrieves the corresponding output values from the table. Lookup tables can be faster than direct mathematical function evaluations, making them useful when an analytical expression is expensive to compute or when no analytical expression exists but the relationship has been determined empirically.
Simulink offers a wide variety of lookup table blocks and objects each tailored for solving different types of nonlinear equations. Additionally, Simulink provides you with a set of look up table tools to fine tune the lookup table data and generate code from those tables for hardware deployment.
Lookup Table Terminologies
This section describes the underlying concepts of look up table blocks and objects and give you an overview on how you can use those to approximate nonlinear equations.
Lookup tables have two major components:
A breakpoint vector consists of input values that index a particular dimension of a lookup table. A lookup table uses breakpoint vectors to relate its input values to the output values that it returns.
Table data is an array that serves as a sampled representation of a function evaluated at lookup table breakpoint values. A lookup table uses breakpoints to index the table data and then return an output value.
This figure illustrates the breakpoint vectors and the table data in a lookup table. In this table:
Input vector of breakpoints1 : [1 2 3]
Input vector of breakpoints2: [1 2 3 4]
Output table data: [f(1,1), f(1,2), f(1,3) f(1,4); f(2,1), f(2,2), f(2,3), f(2,4); f(3,1, f(32), f(3,3), f(3,4)]
If the lookup table does not explicitly define the input values, Simulink estimates an output value using one of these approximation methods:
Interpolation is a process for estimating values that lie between known data points.
Extrapolation is a process for estimating values that lie beyond the range of known data points.
Characteristics and constraints of Lookup Table Data
This section explains different characteristics of the two major components of a lookup table — breakpoint vectors and table data.
Sizes of Breakpoint Vectors and Table Data — These constraints apply to the sizes of breakpoint vectors and table data associated with lookup table blocks:
The memory limitations of your system constrain the overall size of a lookup table.
Lookup tables must also use consistent dimensions so that the overall size of the table data reflects the size of each breakpoint vector.
For example, consider the following vectors of input and output values that create the relationship in the plot.
Vector of input values:   [-3 -2 -1  0 1 2 3]
Vector of output values:  [-3 -1  0 -1 0 1 3]
Monotonicity of Breakpoints — The first stage of a table lookup operation involves relating inputs to the breakpoints. The search algorithm requires that input breakpoint sets be strictly monotonically increasing, where each successive element is greater than its preceding element. For example, this vector is a valid breakpoint vector.
A = [0 0.5 1 1.9 2.1 3]
Note
Although a breakpoint vector is strictly monotonic in
double format, conversion to a fixed-point data type
can affect monotonicity.
Formulation of Evenly Spaced Breakpoints — You can represent evenly spaced breakpoints in a data set by using one of these formulations.
| Formulation | Example | When to Use This Formulation |
|---|---|---|
[first_value:spacing:last_value] | [10:10:200] | The lookup table does not use
double or single. |
first_value + spacing *
[0:(last_value-first_value)/spacing] | 1 + (0.02 * [0:450]) | The lookup table uses double or
single. |
Because floating-point data types cannot precisely represent some numbers, the
second formulation works better for double and
single types. For example, use 1 + (0.02 *
[0:450]) instead of [1:0.02:10]. For a list of
lookup table blocks that support evenly spaced breakpoints, see Summary of Lookup Table Block Features.
Evenly spaced breakpoints can also help generate division-free code and reduce memory usage. For more information, see:
Effects of Spacing on Speed, Error, and Memory Usage (Fixed-Point Designer)
Identify questionable fixed-point operations (Embedded Coder)
Tip
Do not use the MATLAB®
linspace function to define evenly spaced breakpoints.
Simulink uses a tighter tolerance to check whether a breakpoint set has
even spacing. If you use linspace to define breakpoints
for your lookup table, Simulink considers the breakpoints to be unevenly spaced.
Lookup Table Blocks and Objects
You can use these Simulink lookup table blocks and objects to solve nonlinear equations.
1-D Lookup Table — This block maps one input to one output using a defined set of input and output value pairs. For input values not in the table, the block estimates the output through interpolation or extrapolation.
Consider the function y =
x3, which uses one independent
variable. You have a set of known input and output value pairs and you need to find
out output values for input values not included in that set. Use a 1-D Lookup
Table to define the output (y) discretely over a
known input (x) range [-3, 3]. This table and
graph illustrate the corresponding input and output values.
For an input of -2, the table looks up and retrieves the corresponding output value of -8. Likewise, the lookup table outputs 27 in response to an input of 3.
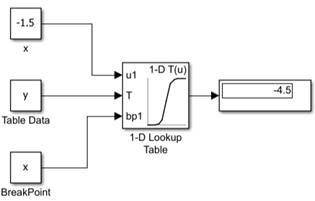
You need to find the output corresponding to an input value of -1.5. However, the lookup table does not define this input value. In this scenario, the block linearly interpolates the nearest adjacent data points (xi, yi) and (xi+1, yi+1). Given these two points:
(xi, yi) is (
-2, -8)(xi+1, yi+1) is (
-1,
                            -1
)
The lookup table estimates and returns a value of -4.5.
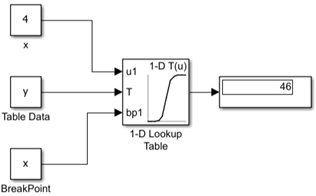
Suppose you need to find the output corresponding to an input value of 4. Since
the lookup table does not include data for x values beyond the
range of [-3, 3], the block extrapolates values using a pair of
data points at either end of the table. Given an input value of 4, the lookup table
block linearly extrapolates the nearest data points (2, 8) and (3, 27) to estimate
an output value of 46.
2-D Lookup Table block — This block maps two input values to one output value using a grid of known input and output values. For input combinations not in the table, the block estimates the output through interpolation or extrapolation.
Consider the nonlinear function z =
x2 +
y2, which uses two independent
variables. Use a 2-D Lookup Table block to define the output
(z) discretely over the known input (x)
range [-2, 2] and input (y) range
[-2, 2].
You need to find the output z for (x =
-1.5, y = -2.5), which
is not defined in the Lookup table. To find the approximate value of
z, set the input of the block to [-1.5,
-2.5].
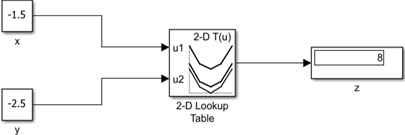
In this example:
Input data (x and y) are defined as breakpoint vectors.
Output data (z) is defined as table data.
x =
-1.5, y =-2.5are breakpoints.An approximation method is specified.
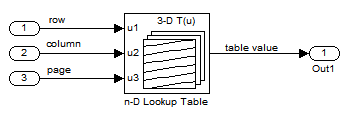
n-D Lookup Table block — This
block maps multiple inputs to one output using an
n- dimensional grid of data, where
n is a finite number. Each input corresponds to one dimension
of the table: the first input identifies the first dimension (row) breakpoints, the
second input identifies the second dimension (column) breakpoints, and the third
dimension (page) identifies the dimension (n).
Simulink.Lookup Table object —
The lookup table blocks explained in this section can also be represented
programmatically using the Simulink.Lookup Table object. You can
use the object properties to specify the lookup table data.
Lookup Table Editor
After you specify the breakpoints and table data in Lookup table blocks, you can visualize and edit the data using the Lookup Table Editor to:
Visualize the table and breakpoint data using a 2-D line plot or contour plot and 3-D mesh or surface plot.
Create a heatmap.
Insert or delete data from the table.
Update the existing data set using with the new data.
Generate reports and register custom lookup tables.
For more information, see Lookup Table Editor.
See Also
1-D Lookup Table | 2-D Lookup Table | n-D Lookup Table | Direct Lookup Table (n-D)
Topics
- Model an Anti-Lock Braking System
- Design a Guidance System in MATLAB and Simulink
- Temperature Measurement System Using Nonlinear Behavioral Data of Type S Thermocouple
- Using the Prelookup and Interpolation Using Prelookup Blocks
- Saving Memory in Prelookup and Interpolation Using Prelookup Blocks by Using Smaller Data

