Generate Random Parameter Values
One way to perform sensitivity analysis is to draw random sets of parameter values and calculate the effects of such random variation on your design requirements. To do so, after you specify the parameters to analyze, you define a parameter space with specified probability distributions and correlations between parameter values. You can also specify the method by which to draw parameter values from the probability distribution, as well as the number of samples to draw.
You can specify these characteristics of the parameter space either in the Sensitivity Analyzer app or at the command line.
Number of Samples
Choose enough samples to yield useful results. However, each model evaluation has a computational expense and can be time intensive. As the number of parameters increases, the number of samples required to explore the design space generally increases. For correlation or regression analysis, consider using 10Np samples, where Np is the number of parameters.
Sampling Method
Specify the method used to generate the samples. You can choose from the following methods:
Random — Random samples are drawn from the probability distributions specified for the parameters.
If you specify correlation between parameters, the software uses the Iman-Conover algorithm to impose the parameter correlations.
Latin hypercube— Latin hypercube samples are drawn from the probability distributions specified for the parameters. Use this option for a more systematic space-filling approach than random sampling. The Sobol and Halton quasirandom sampling methods are more space-filling than the Latin hypercube method.
If you specify correlation between parameters, the software uses the Iman-Conover algorithm to impose the parameter correlations.
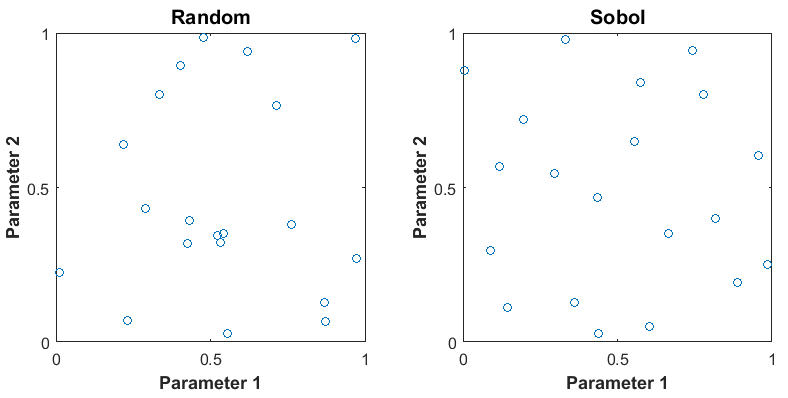
Sobol — Requires Statistics and Machine Learning Toolbox™ software. Sobol quasirandom sequences are drawn from the probability distributions specified for the parameters. Use this method for highly systematic space-filling.
The figure shows 20 samples for two parameters. The samples are generated from a uniform distribution, in the interval from 0 to 1. Random sampling can result in large gaps between some samples, and close clustering of other samples. Sobol and Halton quasirandom sampling methods avoid gaps and clustering of samples. If you have many parameters in your parameter set, Sobol sets gives more systematic space filling than Halton quasirandom sets. For more information, see Generating Quasi-Random Numbers (Statistics and Machine Learning Toolbox).
If you specify correlation between parameters, the software uses the Iman-Conover algorithm to impose the parameter correlations.
Halton — Requires Statistics and Machine Learning Toolbox software. Halton quasirandom sequences are drawn from the probability distributions specified for the parameters. Like the Sobol method, you can use Halton method for highly systematic space-filling. However, Sobol method gives more systematic space filling if you have many parameters in your parameter set. For more information, see Generating Quasi-Random Numbers (Statistics and Machine Learning Toolbox).
If you specify correlation between parameters, the software uses the Iman-Conover algorithm to impose the parameter correlations.
Copula— Requires Statistics and Machine Learning Toolbox software. Random samples are drawn from a copula. Use this option to impose correlations between the parameters using copulas.
You can use either a Gaussian copula (default) or a t copula. Use t copulas when the probability of extreme parameter values is not negligible (distribution is heavy-tailed), and specify the degrees of freedom. As you increase the degrees of freedom, the t copula converges to the Gaussian copula, and the probability of extreme parameter values becomes negligible. The following figure shows 1000 samples drawn for two parameters in the interval from 0 to 1 using the Gaussian and t copulas.
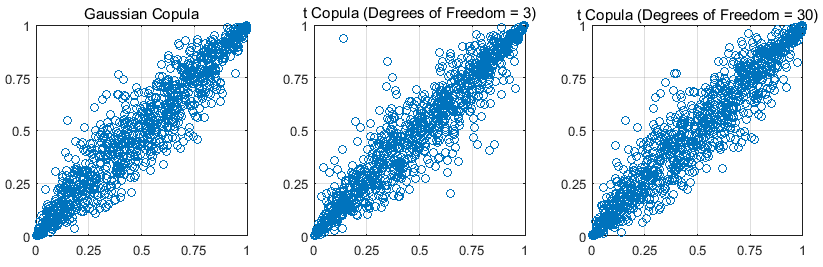
In comparison to the Gaussian copula, the t copula has more samples that represent the extreme values of the parameters. As the degrees of freedom are increased, the t copula converges to the Gaussian copula.
Specify the correlation type as either Spearman’s rank correlation or Kendall’s rank correlation.
Probability Distribution
Specify the probability distribution function and related distribution characteristics for each parameter. Use your knowledge of the system (empirical or theoretical) to choose the probability distributions.
Note
Simulink® Design Optimization™ software allows you to specify uniform (default), normal, multinomial, piecewise linear, and triangular distributions. For other distributions, you need Statistics and Machine Learning Toolbox software.
Consider the following characteristics of your parameters when choosing a distribution:
| Parameter Characteristics | Applicable Distributions |
|---|---|
Extends from - to |
|
Bounded at both ends |
|
Extends from 0 to |
|
Custom distribution | Piecewise linear |
For more information about these distributions, see the Probability Distributions and Hypothesis Tests (Statistics and Machine Learning Toolbox) category.
Parameter Correlations
Specify the correlation between parameters. The algorithm used to impose the parameter correlations depends on the sampling method. For more information, see Sampling Method.
Generate Random Parameter Values in the App
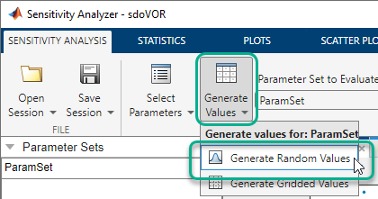
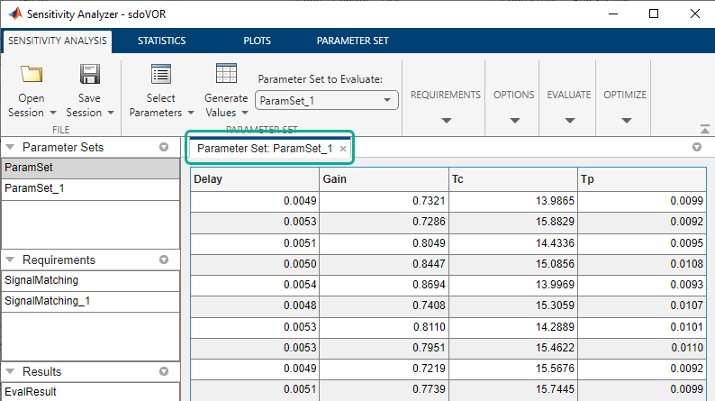
In the Sensitivity Analyzer, after you have selected the parameters in the parameter set, click Generate Values and, select Generate Random Values.
In the Generate Random Parameter Values dialog box, specify the number of samples, probability distributions, parameter bounds and correlations, and sampling method. For information about how to specify the fields in the dialog box, click Help.
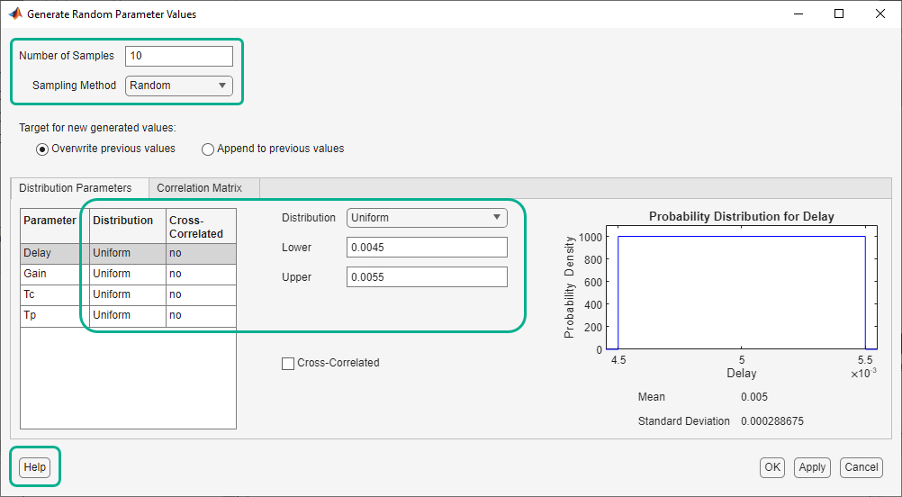
The generated parameter set and the corresponding parameter set table are displayed in the app. The number of rows in the parameter set table correspond to the number of samples you specified.
After generating the parameter values, plot them to check if generated parameter values match the intended specifications. This is relevant if you generate a small number of random samples for each parameter set. For more information, see Inspect the Generated Parameter Set.
For an example, see Identify Key Parameters for Estimation (GUI).
Generate Random Parameter Values at the Command Line
At the command line, use sdo.ParameterSpace to define the
parameter space. This object specifies the probability distributions and
correlations for the parameters. Use this object as an input to sdo.sample for generating parameter values from the specified
parameter space.
To generate the random parameter values:
Specify the number of samples as the second input argument of
sdo.sample.Specify the method used to generate these samples using the
Methodproperty of ansdo.SampleOptionsobject. Use this object as an input tosdo.sampleto specify the sampling options.If the method chosen is
'sobol'or'halton', specify theMethodOptionsproperty ofsdo.SampleOptions.If the method chosen is
'copula', specify the choice of copula using theMethodOptionsproperty ofsdo.SampleOptions. Also specify theRankCorrelationproperty of thesdo.ParameterSpaceobject.Specify the probability distribution of a parameter using the
ParameterDistributionsproperty of ansdo.ParameterSpaceobject.Specify correlation between parameters, using the
RankCorrelationproperty of thesdo.ParameterSpace.
After generating the parameter values, plot the generated values to check if they match the desired specifications. This is relevant if you generate a small number of random samples for each parameter set. For more information, see Inspect the Generated Parameter Set.
For an example, see Identify Key Parameters for Estimation (Code).
Generate Custom Parameter Values at the Command Line
This example shows how to generate random parameter values with a custom
distribution when performing sensitivity analysis at the command line. Generate a
1000 samples of a model parameter, R, in the 5% range of its
nominal value, 10. R is a resistor. Resistors of 1% tolerance are
removed by the manufacturer, so do not generate R values in the
1% range of its nominal value.
Construct a
param.Continuousobject.R = param.Continuous('R',10);Create a customized probability distribution,
pdR, to configure the parameter space.x = [0.95 0.99 1.01 1.05]*R.Value; F = [0 0.5 0.5 1]; pdR = makedist('PiecewiseLinear','x',x,'Fx',F); x = linspace(0.9*R.Value,1.1*R.Value,1e3); plot(x,pdf(pdR,x));
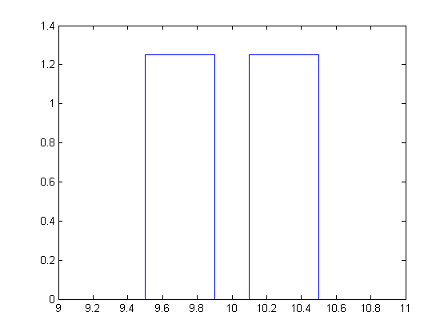
makedistspecifies a piecewise linear distribution for the resistor value, with a “hole” in the 1% range.Specify
pdRas the probability distribution for theRparameter in ansdo.ParameterSpaceobject.ps = sdo.ParameterSpace(R,pdR);
Generate 1000 samples.
Ns = 1000;
x = sdo.sample(ps,Ns);
(Optional) Use
sdo.scatterPlotto visualize the samples and validate the sample space.
See Also
sdo.ParameterSpace | sdo.sample | sdo.SampleOptions