plotSurvival
Syntax
Description
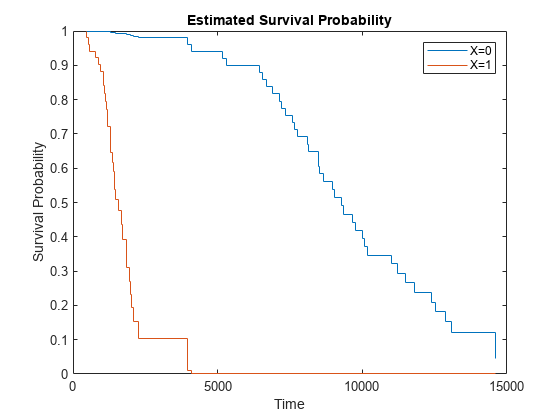
plotSurvival( plots the baseline
survival function of a Cox proportional hazards model coxMdl)coxMdl. The
survival function at time t is the estimated probability of survival
until time t. The term baseline refers to the
survival function at the determined baseline of the predictors. This value is stored in
coxMdl.Baseline, and the default value is the mean of the data set used
for training.
plotSurvival(
plots the survival function for the given value of the stratification variable
coxMdl,X,Stratification)Stratification. You must have one row in
Stratification for each row in X.
Note
When you train coxMdl using stratification variables and
pass predictor variables X,
plotSurvival also requires you to pass
stratification variables.
plotSurvival(___,
specifies additional options using one or more name-value arguments. For example,
Name,Value)plotSurvival(CoxMdl,"Time",T) plots the survival function at times
T.
graphics = plotSurvival(___) returns an array of
Stair graphics objects. See Stair Properties.
Examples
Input Arguments
Name-Value Arguments
Version History
Introduced in R2021a


