Main Content

survival

Calculate survival of Cox proportional hazards model

Since R2021a

    Description

    s = survival(coxMdl) estimates the baseline survival function of a Cox proportional hazards model coxMdl. The survival function at time t is the estimated probability of survival until time t. The term baseline refers to the survival function at the determined baseline of the predictors. This value is stored in coxMdl.Baseline, and the default value is the mean of the data set used for training.

    example

    s = survival(coxMdl,X) estimates the survival function when the predictors have the values in X. In this case, s is a column for each row of X.

    example

    s = survival(coxMdl,X,Stratification) estimates the survival function for the given value of the stratification variable Stratification. You must have one row in Stratification for each row in X.

    Note

    When you train coxMdl using stratification variables and pass predictor variables X, survival also requires you to pass stratification variables.

    example

    s = survival(___,Name,Value) specifies additional options using one or more name-value arguments, using any of the input argument combinations in the previous syntaxes. For example, survival(CoxMdl,"Time",T) computes the survival at times T.

    example

    [s,Tout] = survival(___) also returns the times Tout at which each survival estimate is calculated.

    Examples

    collapse all

    Perform a Cox proportional hazards regression on the lightbulb data set, which contains simulated lifetimes of light bulbs. The first column of the light bulb data contains the lifetime (in hours) of two different types of bulbs. The second column contains a binary variable indicating whether the bulb is fluorescent or incandescent; 0 indicates the bulb is fluorescent, and 1 indicates it is incandescent. The third column contains the censoring information, where 0 indicates the bulb was observed until failure, and 1 indicates the observation was censored.

    Fit a Cox proportional hazards model for the lifetime of the light bulbs, accounting for censoring. The predictor variable is the type of bulb.

    load lightbulb
    coxMdl = fitcox(lightbulb(:,2),lightbulb(:,1), ...
        'Censoring',lightbulb(:,3));

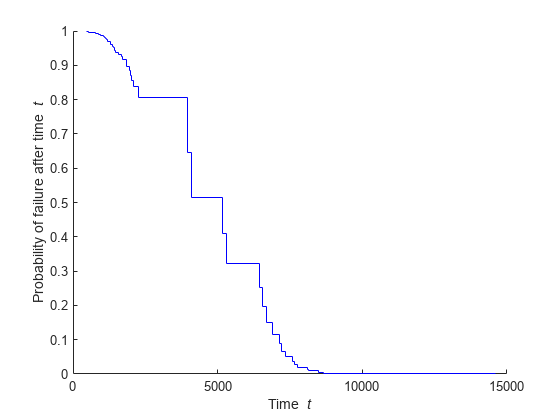
    Calculate the baseline survival function as a function of time t, meaning the probability that a light bulb fails after time t. By default, the baseline is calculated for the mean of the predictor, which in this case is mean(lightbulb(:,2)) = 0.5. Return the times Tout at which the survival function is calculated.

    [s,Tout] = survival(coxMdl);

    Plot the survival as a stairstep graph of time. (The times Tout are also in coxMdl.Hazard(:,1).)

    hold on;
    stairs(Tout,s,'b-')
    xlabel 'Time \it t'
    ylabel 'Probability of failure after time \it t'

    Overlay the plot with the survival functions for fluorescent and incandescent bulbs.

    s_fluorescent = survival(coxMdl,0);
    s_incandescent = survival(coxMdl,1);
    stairs(Tout,s_fluorescent,'r-')
    stairs(Tout,s_incandescent,'k-')
    legend('Baseline','Fluorescent','Incandescent')
    hold off

    To create plots without first creating the survival data, use plotSurvival.

    Load the coxModel data. (This simulated data is generated in the example Cox Proportional Hazards Model Object.) The model named coxMdl has three stratification levels (1, 2, and 3) and a predictor X with three categorical values (1, 1/20, and 1/100).

    load coxModel

    Calculate the survival function for X = 1 at the three stratification levels.

    c1 = categorical(1);
    X = [c1;c1;c1];
    stratification = [1;2;3];
    s = survival(coxMdl,X,stratification);

    Plot the three survival functions. First, find the times for the three stratification levels.

    t1 = find(coxMdl.Hazard(:,3) == 1);
    t1 = coxMdl.Hazard(t1,1);
    t2 = find(coxMdl.Hazard(:,3) == 2);
    t2 = coxMdl.Hazard(t2,1);
    t3 = find(coxMdl.Hazard(:,3) == 3);
    t3 = coxMdl.Hazard(t3,1);

    Plot the survival for the three levels. View the plot for times 1 through 30.

    plot(t1,s{1},t2,s{2},t3,s{3})
    xlim([1,30])
    legend('Stratification Level 1','Stratification Level 2','Stratification Level 3','Location','northeast')
    xlabel('Time t')
    ylabel('Probability of Survival Past t')

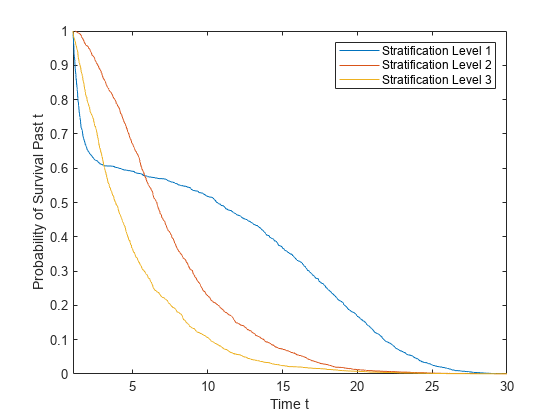
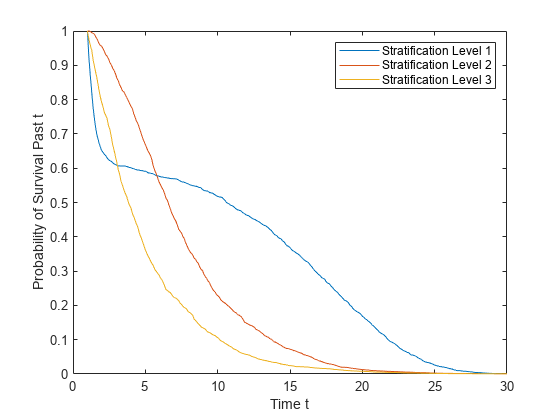
    Alternatively, evaluate the survival for times 1 through 30 by specifying the Time argument.

    t = linspace(1,30,300);
    st = survival(coxMdl,X,stratification,'Time',t);
    figure
    plot(t,st{1},t,st{2},t,st{3})
    legend('Stratification Level 1','Stratification Level 2','Stratification Level 3','Location','northeast')
    xlabel('Time t')
    ylabel('Probability of Survival Past t')

    Input Arguments

    collapse all

    Fitted Cox proportional hazards model, specified as a CoxModel object. Create coxMdl using fitcox.

    Predictors for the model, specified as an array of predictors of the same type used for training coxMdl. Each row of X represents one set of predictors.

    Data Types: double | table | categorical

    Stratification level, specified as a variable or variables of the same type used for training coxMdl. Specify the same number of rows in Stratification as in X.

    Data Types: single | double | logical | char | string | table | cell | categorical

    Name-Value Arguments

    Specify optional pairs of arguments as Name1=Value1,...,NameN=ValueN, where Name is the argument name and Value is the corresponding value. Name-value arguments must appear after other arguments, but the order of the pairs does not matter.

    Before R2021a, use commas to separate each name and value, and enclose Name in quotes.

    Example: survival(CoxMdl,Time=T)

    Extrapolation method to compute the survival for out-of-range times, specified as one of the listed values. A CoxModel object uses the cumulative baseline hazard, stored in CoxModel.Hazard, to compute the baseline survival function in the survival or plotSurvival functions. For times within the range (defined next), results are from linear interpolation of the baseline survival function.

    For a nonstratified model, the range is [T1,T2], where T1 is (1 - eps) times the earliest training time, and T2 is the latest training time. The ExtrapolationMethod for a time T gives the following result:

    • 'nearest' (default) — If T < T1, the result is for time T1. If T > T2, the result is for time T2.

    • 'linear' — The result is a linear extrapolation from the nearest time in the range. Extrapolated survival values are truncated to lie in [0,1]. In other words, if val is the returned survival value and extrapval is the linear extrapolation, then

      val = max(0, min(1,extrapval)).

    • 'next' — If T < T1, the result is for time T1. If T > T2, the result is NaN.

    • 'none' — If T < T1 or T > T2, the result is NaN.

    • 'previous' — If T < T1, the result is NaN. If T > T2, the result is for time T2.

    For each stratum in a stratified model, define the time range exactly as for a nonstratified model, using the event times in that stratum. The extrapolated values of survival in each stratum use the ExtrapolationMethod applied to the stratum range.

    Example: 'next'

    Data Types: char | string

    Times for survival estimates, specified as a real vector. survival sorts the specified times and converts them to a column vector, if necessary. For an unstratified model and times in the range of coxMdl.Hazard(:,1), the resulting values are linearly interpolated from times in the training data. For Time values outside the fitting data range, the survival is extrapolated using the extrapolation method specified in ExtrapolationMethod.

    For stratified models, distinct time ranges for each stratum in coxMdl.Hazard(:,1) are separated by 0s in coxMdl.Hazard(:,2). survival estimates the survival in each stratum using the same procedure as for an unstratified model.

    Example: 0:40

    Data Types: double

    Output Arguments

    collapse all

    Survival estimates, returned as a numeric column vector or a cell array of numeric column vectors.

    • For a nonstratified model, s is a sorted numeric column vector of estimated probabilities.

    • For a stratified model, s is a cell array of sorted numeric column vectors of the estimated probabilities for each stratification level.

    survival returns a column of survival estimates for each row of X.

    Times for survival estimates, returned as one of the following.

    • For a nonstratified model, Tout is a sorted numeric column vector of times in the training set.

    • For a stratified model, Tout is a cell array of sorted numeric column vectors of the training times in the training set for each stratification level.

    The coxMdl.Hazard(:,1) vector contains the times for both stratified and nonstratified models. For stratified models, the times for different stratification levels are separated by a 0 entry.

    Data Types: double | cell

    Version History

    Introduced in R2021a