Blob Analysis
Statistics for labeled regions
Libraries:
Computer Vision Toolbox /
Statistics
Description
The Blob Analysis block calculates statistics for labeled regions in a binary image. The block returns quantities such as the centroid, bounding box, label matrix, and blob count. The Blob Analysis block supports input and output variable-size signals. You can also use the Selector (Simulink) block from Simulink®, to select certain blobs based on their statistics.
For information on pixel and spatial coordinate system definitions, see Image Coordinate Systems and Coordinate Systems.
Examples
Find Statistics of Circular Blobs in Image
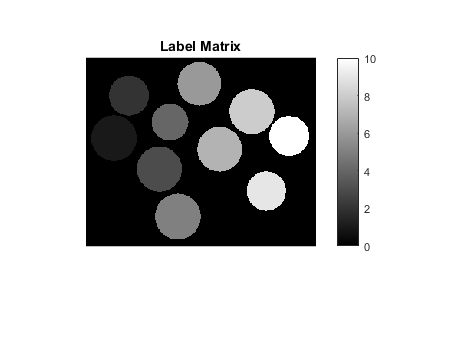
Find the centroid, perimeter, and bounding box coordinates of circular blobs in an image by using the Blob Analysis block. The model also outputs the label matrix for reference.
Ports
Input
Output
Parameters
Main Tab
Number of pixels in labeled regions, returned as a vector.
Dependencies
To enable this port, select the Area parameter.
M-by-2 matrix of M number of blobs.
The rows represent the coordinates of the centroid of each region, and M represents the number of blobs.
For example, there are two blobs where the row and column coordinates of their centroids are x1, y1 and x2, y2. The block outputs:
at the Centroid port.
Dependencies
To enable this port, select the Centroid parameter.
Bounding box coordinates, returned as an M-by-4 matrix of M bounding boxes for blobs. Each row of the matrix defines a bounding box as a four-element vector [x,y,width,height] in pixel coordinates. The rows represent the coordinates of each bounding box, where M represents the number of blobs.
For example, there are two blobs, where x and y define the location of the upper-left corner of the bounding box, and w and h define the width and height of the bounding box. The block outputs
at the BBox port.
Dependencies
To enable this port, select the Bounding Box parameter.
Enables the Major axis length port. Select this check box to output a vector that
Represents the lengths of the major axes of ellipses
Has the same normalized second central moments as the labeled regions
Enables the Minor axis length port. Select this check box to output a vector that
Represents the lengths of the minor axes of ellipses
Has the same normalized second central moments as the labeled regions
Enables the Orientation port.
Select this check box to output a vector that represents the angles between the major axes of the ellipses and the x-axis. The angle values are in radians and range between: and inclusive.
Enables the Eccentricity port. Select this check box to output a vector that represents the eccentricities of ellipses that have the same second moments as the region.
Enables the Equivalent diameter squared port. Select this check box to output a vector that represents the equivalent diameters squared.
Enables the Extent port. Select this check box to output a vector that represents the results of dividing the areas of the blobs by the area of their bounding boxes.
Enables the Perimeter port. Select this check box to output an N-by-1 vector of the perimeter lengths, in pixels, of each blob, where N is the number of blobs.
Specify the data type of the outputs as double,
single, or Specify via Data Types
tab.
Specify the number of labeled regions in each image.
Define which pixels connect to each other. If you want to connect pixels located on
the top, bottom, left, and right, select 4. If you want to
connect pixels to other pixels on the top, bottom, left, right, and diagonally, select
8. For more information about this parameter, see the
Label block.
The Connectivity parameter also affects how the block
calculates the perimeter of a blob. For example, this figure illustrates how the block
calculates the perimeter when you set the Connectivity parameter to
4.
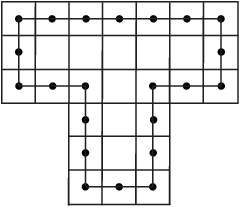
The block calculates the distance between the center of each pixel (marked by the black dots) and estimates the perimeter to be 22.
The next figure illustrates how the block calculates the perimeter of a blob when
you set the Connectivity parameter to 8.
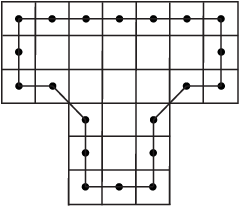
The block takes a different path around the blob and estimates the perimeter to be .
Enable the Label port. Select this check box to output the
label matrix. The pixels equal to 0 represent the background. The
pixels equal to 1 represent the first object. The pixels equal to
2 represent the second object, and so on.
Blob Properties Tab
Specify the maximum number of labeled regions in each input image. The block uses this value to preallocate vectors and matrices to ensure that they are long enough to hold the statistical values. The maximum number of blobs the block outputs depends on both the value of this parameter and the size of the input image. The number of blobs the block outputs may be limited by the input image size.
Select this parameter to warn if maximum number of blobs is exceeded.
Enable the Count port. Select this parameter to output a scalar value that represents the actual number of connected regions in each image.
Select this parameter to specify the minimum blob area in pixels. The blob is labeled if the number of pixels meets the minimum size specified.
Tunable: Yes
Select this parameter to specify the maximum blob area in pixels. The blob is
labeled if the number of pixels meets the maximum size specified. The maximum allowable
value is the maximum of the uint32 data type.
Tunable: Yes
Specify this parameter to exclude a labeled blob that contains at least one border pixel.
Specify this parameter to output blob statistics as a variable-size signal.
Specify this parameter to fill empty spaces in the statistical vectors with the values you specify in the Fill values parameter.
Dependencies
To enable this parameter, clear the Output blob statistics as a variable size signal parameter.
Specify a scalar value to fill all the empty spaces in the statistical vectors. If you enter a vector, it must have the same length as the number of selected statistics. The block uses each vector element to fill a different statistics vector. If the empty spaces do not affect your computation, you can clear the Fill empty spaces in outputs parameter.
Dependencies
To enable this parameter, clear the Output blob statistics as a variable size signal parameter.
Data Types Tab
To enable option on the Data Types tab, in the
Main tab, set the Statistics output data type
parameter to Specify via Data Types tab. For details on the
fixed-point block parameters, see Specify Fixed-Point Attributes for Blocks (DSP System Toolbox).
Block Characteristics
Data Types | |
Multidimensional Signals |
|
Variable-Size Signals |
|
a Generated code will be restricted to MATLAB host computers when you set the FFT implementation parameter to FFTW, or when the transform length is not a power of two. b This data type is supported at the output port(s). c Fixed-point data types are not supported at the Major Axis, Minor Axis, Orientation, and Eccentricity output ports. | |
Extended Capabilities
Version History
Introduced before R2006a